Previous Month
05/31/2026High: $18.07
Low: $17.61

James Aggressive Allocation Fund seeks to provide total return through a combination of growth and income. Preservation of capital in declining markets is a secondary objective.
The James Aggressive Allocation Fund is a portfolio comprised of both equity and debt securities that seeks return primarily through growth and income and secondarily through preservation of capital. Under normal circumstances, the Fund invests primarily in equity securities of foreign and domestic companies that the Adviser believes are undervalued, and in high quality fixed income securities. The Fund will normally hold both equity securities and fixed income securities, with typically at least 60% of its assets in equity securities and at least 15% of its assets in fixed income securities. On occasion, the Fund could hold as little as 50% in equity securities or as high as 100%. Equity securities that the Fund will principally invest in are common stocks, preferred stocks and exchange traded funds ("ETFs") that invest primarily in equity securities. Some or all of the equity portion of the Fund may be invested in small and micro capitalization companies. Fixed income securities that the Fund will principally invest in are U.S. government securities, corporate bonds, municipal bonds and/or sovereign bonds of any maturity, as well as ETFs that invest primarily in such securities. Any non-U.S. government securities in the Fund's portfolio will consist primarily of issues rated "Baa2" or better by Moody's Investors Service, Inc. ("Moody's") or "BBB" or better by Standard & Poor's Ratings Group ("S&P") and unrated securities determined by the Adviser to be of equivalent quality, as well as high quality money market instruments.
6.30%
Avg. Annual Return
10.80%
YTD Return
$18.14
Daily Price
06/12/2026
$29M
Net Assets
High: $18.07
Low: $17.61
The Morningstar Star RatingTM for the James Aggressive Allocation Fund (JAVAX) is based on risk-adjusted returns as of 3/31/2026 in the Moderately Aggressive Allocation category out of 123 funds overall and in the last 3 years, 117 funds in the last 5 years, and 100 funds in the last 10 years.
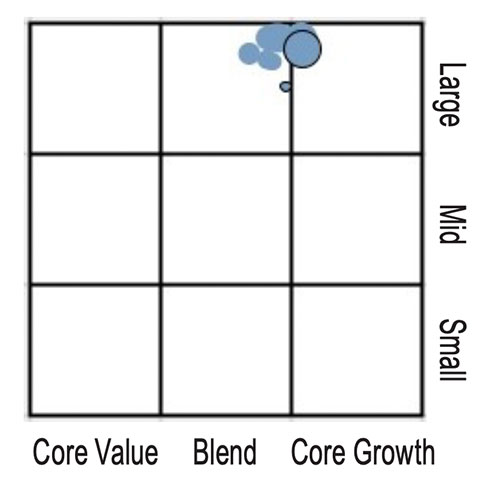
The Morning Star Style Map is the Morningstar Style Box™ with the center 75% of fund holdings plotted as the Morningstar Ownership Zone™. The Morningstar Style Box is designed to review a fund's investment strategy. The Morningstar Ownership Zone provides detail about a portfolio's investment style by showing the range of stock sizes and styles. The Ownership Zone is derived by plotting each stock in the portfolio within the proprietary Morningstar Style Box. Over time, the shape and location of a fund's ownership zone may vary.
Prices are usually updated each business day by 7 pm EST.
| Daily Price & YTD Return Data as of 06/12/2026 |
Total % Return Data as of 05/31/2026 |
Average Annual Total % Return as of 05/31/2026 |
||||||||||
|---|---|---|---|---|---|---|---|---|---|---|---|---|
| Fund Name | Ticker | Price / Share | $ Change | YTD | YTD | 1 Mo | 3 Mo | 1 Yr | 3 Yr | 5 Yr | 10 Yr | S.I. ** |
|
Aggressive Allocation Inception Date: 07/01/2015 Total Expense Ratio: (1.02%) |
JAVAX | 18.14 | 0.04 | 11.36 | 10.80 | 1.18 | 5.87 | 29.09 | 19.70 | 10.24 | 7.70 | 6.30 |
|
James Aggressive Blend Index * |
7.56 | 3.49 | 6.22 | 20.63 | 16.25 | 8.45 | 10.55 | 9.90 | ||||
|
VettaFi US Equity 3000 Index ** |
11.51 | 5.15 | 10.29 | 29.90 | 23.27 | 12.85 | 15.13 | 13.88 | ||||
| Daily Price & YTD Return Data as of 06/12/2026 |
Total % Return Data as of 03/31/2026 |
Average Annual Total % Return as of 03/31/2026 |
||||||||||
|---|---|---|---|---|---|---|---|---|---|---|---|---|
| Fund Name | Ticker | Price / Share | $ Change | YTD | YTD | 1 Mo | 3 Mo | 1 Yr | 3 Yr | 5 Yr | 10 Yr | S.I. ** |
|
Aggressive Allocation Inception Date: 07/01/2015 Total Expense Ratio: (1.02%) |
JAVAX | 18.14 | 0.04 | 11.36 | 0.49 | -3.99 | 0.49 | 21.30 | 16.37 | 9.10 | 6.66 | 5.44 |
|
James Aggressive Blend Index * |
-2.66 | -3.87 | -2.66 | 13.15 | 12.72 | 7.17 | 9.65 | 9.04 | ||||
|
VettaFi US Equity 3000 Index ** |
-3.88 | -4.94 | -3.88 | 18.28 | 17.87 | 10.74 | 13.70 | 12.55 | ||||
* 65% VettaFi US Equity 3000 Total Return Index / 35% Bloomberg U.S. Aggregate Government/Credit Bond Index
The performance data quoted represents past performance. Past performance is no guarantee of future results. Current performance may be lower or higher than performance data quoted. The investment return and principal value of an investment in the Fund will fluctuate so that an investor's shares, when redeemed, may be worth more or less than their original cost. The average annual total returns assume reinvestment of income, dividends and capital gains distributions and reflect changes in net asset value. You should note that the James Advantage Funds are professionally managed mutual funds while the indices are unmanaged, do not incur expenses and are not available for investment.
| Ticker | JAVAX |
|---|---|
| 05/31/2026 | 1.18% |
| 04/30/2026 | 8.98% |
| 03/31/2026 | -3.99% |
| 02/28/2026 | 1.01% |
| 01/31/2026 | 3.62% |
| Ticker | JAVAX |
|---|---|
| 03/31/2026 | 0.49% |
| 12/31/2025 | 2.37% |
| 09/30/2025 | 8.04% |
| 06/30/2025 | 9.14% |
| 03/31/2025 | -3.96% |
| Ticker | JAVAX |
|---|---|
| 12/31/2025 | 15.92% |
| 12/31/2024 | 19.13% |
| 12/31/2023 | 19.31% |
| 12/31/2022 | -15.80% |
| 12/31/2021 | 16.87% |
| Information Technology | 21.10% |
| Financials | 12.40% |
| Communication Services | 8.90% |
| Industrials | 8.20% |
| Health Care | 7.40% |
| Total as % of Fund | 58.00% |
|---|---|
| Semiconductors | 12.30% |
| Internet Software/Services | 6.00% |
| Pharmaceuticals: Major | 5.30% |
| Finance/Rental/Leasing | 4.30% |
| Integrated Oil | 4.00% |
| Total as % of Fund | 31.90% |
|---|---|
| NVIDIA Corp | 4.40% |
| Alphabet Inc Class A | 3.80% |
| Broadcom Inc | 3.30% |
| Enova International Inc | 3.10% |
| Apple Inc | 2.90% |
| Goldman Sachs Group Inc | 2.70% |
| ASML Holding NV | 2.70% |
| Walmart Inc | 2.20% |
| Meta Platforms Inc | 2.20% |
| JP Morgan Chase & Co. | 2.10% |
| Total as % of Fund | 29.40% |
|---|---|
| United States | 88.50% |
| Netherlands | 3.30% |
| Taiwan | 2.40% |
| Total as % of Fund | 94.20% |
|---|---|
Holdings are subject to change without notice.
Current and future portfolio holdings are subject to risk.
| Ticker | JAVAX |
|---|---|
| Inception Date | 07/01/2015 |
| Cusip | 470259789 |
| Total Net Assets as of 03/31/2026 ($mil) | $28.60 |
| Price/Earnings Ratio (12m trailing) | 22.94 |
| Price/Book Ratio | 6.66 |
| Weighted Average Market Capitalization ($mil) | $905,420.0 |
| Median Market Capitalization ($ mil) | $156,908.8 |
| Total Number of Equity Issues | 82 |
| Total Number of Debt Issues | 82 |
| Portfolio Turnover Rate (annualized as of Fiscal Year-End 11/01/2025) | 12.00% |
| JAVAX | |
|---|---|
| Management Fee | 0.98% |
| Distribution (12b-1) Fee | 0.00% |
| Other Expenses | 0.03% |
| Acquired Fund Fees and Expenses (AFFE) | 0.01% |
| Total Annual Fund Operating Expenses | 1.02% |
1.09
Beta
0.93
R-Squared
10.66
Standard Deviation
1.14
Sharpe Ratio
| EX-Date | Payable Date | Dividend Type | JAVAX Dividend Amount | JAVAX Reinvestment Price |
|---|---|---|---|---|
| 12/30/2025 | 12/31/2025 | Income | $0.0903 | $16.39 |
| 12/30/2024 | 12/31/2024 | Income | $0.0947 | $14.17 |
| 12/28/2023 | 12/29/2023 | Income | $0.0750 | $11.97 |
| 12/28/2022 | 12/28/2022 | Income | $0.0834 | $9.98 |
| 12/29/2021 | 12/30/2021 | Income | $0.0242 | $12.09 |
| 12/29/2020 | 12/30/2020 | Income | $0.0886 | $10.27 |
| 12/27/2019 | 12/30/2019 | Income | $0.1070 | $10.60 |
| 12/28/2018 | 12/31/2018 | Income | $0.0886 | $9.30 |
| 12/28/2017 | 12/29/2017 | Income | $0.0779 | $10.95 |
| 12/05/2017 | 12/06/2017 | Long Term Cap Gain | $0.0000 | $10.80 |
| 12/29/2016 | 12/30/2016 | Income | $0.0886 | $9.91 |
| 12/30/2015 | 12/31/2015 | Income | $0.0313 | $9.18 |
| High | $16.63 | 12/11/2025 |
| Low | $12.38 | 04/08/2025 |
| High | $18.07 | 05/28/2026 |
| Low | $17.61 | 05/19/2026 |
| JAVAX | Prospectus | Annual | Semi-Annual | SAI | Fact Sheet |
James Investment Research, Inc. is registered with the U.S. Securities and Exchange Commission (SEC) under the Investment Advisers Act of 1940. The information and opinions on this website are for general information only, based on sources we consider reliable, but cannot guarantee its accuracy. It should also not be regarded as a solicitation to buy or sell any securities mentioned. Moreover, no client or prospective client should assume that any such discussion serves as the receipt of, or replacement for, personalized financial advice, as it does not take into consideration your unique financial situation, goals, or requirements.
Investing involves risk, including the loss of principal. Past performance is no guarantee of future results.
James Advantage Funds are offered only to US citizens and residents and any information on the website is intended solely for that purpose. Nothing on this website should be considered a solicitation to buy or an offer to sell any James funds in any jurisdiction where offer or solicitation would be unlawful under the securities laws of such jurisdiction. For international investors, please see Institutional.
Small and Micro Cap investing involve greater risk not associated with investing in more established companies, such as greater price volatility, business risk, less liquidity and increased competitive threat. Fund holdings and sector weightings are subject to change without notice. Past performance is no guarantee of future results.
The James Advantage Mutual Funds are distributed by Ultimus Fund Distributors, LLC (Member FINRA) Private and separately managed accounts and related investment advisory services are provided by James Investment Research, Inc., a federally registered investment advisor. Ultimus Fund Distributors, LLC is not affiliated with James Investment Research, Inc.
You should carefully consider the investment objectives, potential risks, management fees, and charges and expenses of the Fund before investing. The Fund's prospectus contains this and other information about the Fund, and should be read carefully before investing. You may obtain a current copy of the Fund's prospectus by calling 1-800-995-2637 or click here to view or download a prospectus online.