Previous Month
06/30/2026High: $26.87
Low: $25.11

James Micro Cap Fund seeks to provide long-term capital appreciation.
The James Micro Cap Fund invests primarily in equity securities of foreign and domestic companies that the Adviser believes are undervalued. Equity securities include common stocks, preferred stocks and exchange traded funds ("ETFs") that invest primarily in equity securities. Under normal circumstances, the Fund will invest at least 80% of its net assets (plus the amount of borrowing for investment purposes, if any) in equity securities of micro capitalization companies. Micro capitalization companies are defined as those companies with market capitalizations at the time of purchase no larger than the stocks in the VettaFi US Equity Micro-Cap TR Index, including ETFs that invest primarily in such securities.
10.20%
Avg. Annual Return
21.09%
YTD Return
$26.73
Daily Price
07/28/2026
$32M
Net Assets
High: $26.87
Low: $25.11
The Morningstar Star RatingTM for the James Micro Cap Fund (JMCRX) is based on risk-adjusted returns as of 6/30/2026 in the Small Value category out of 453 funds overall and in the last 3 years, 432 funds in the last 5 years, and 362 funds in the last 10 years.
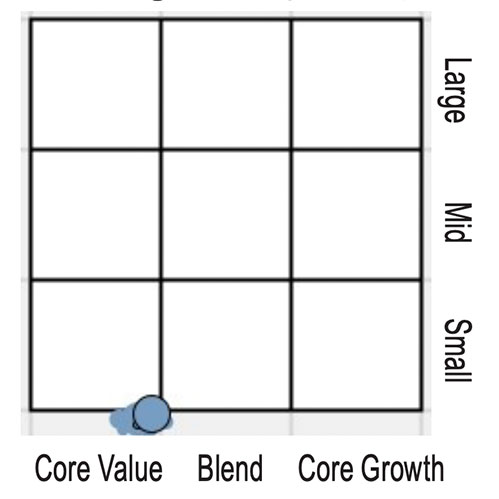
The Morning Star Style Map is the Morningstar Style Box™ with the center 75% of fund holdings plotted as the Morningstar Ownership Zone™. The Morningstar Style Box is designed to review a fund's investment strategy. The Morningstar Ownership Zone provides detail about a portfolio's investment style by showing the range of stock sizes and styles. The Ownership Zone is derived by plotting each stock in the portfolio within the proprietary Morningstar Style Box. Over time, the shape and location of a fund's ownership zone may vary.
Prices are usually updated each business day by 7 pm EST.
| Daily Price & YTD Return Data as of 07/28/2026 |
Total % Return Data as of 06/30/2026 |
Average Annual Total % Return as of 06/30/2026 |
||||||||||
|---|---|---|---|---|---|---|---|---|---|---|---|---|
| Fund Name | Ticker | Price / Share | $ Change | YTD | YTD | 1 Mo | 3 Mo | 1 Yr | 3 Yr | 5 Yr | 10 Yr | S.I. * |
|
Micro Cap Inception Date: 07/01/2010 Total Expense Ratio: (1.50%) |
JMCRX | 26.73 | 0.14 | 20.46 | 21.09 | 6.92 | 14.10 | 30.26 | 16.60 | 9.89 | 9.53 | 10.20 |
|
VettaFi US Equity 3000 Index * |
11.12 | -0.35 | 15.61 | 23.19 | 20.45 | 12.21 | 15.06 | 14.99 | ||||
|
VettaFi US Equity Micro Cap Index ** |
- | - | - | - | - | - | - | - | ||||
The performance data quoted represents past performance. Past performance is no guarantee of future results. Current performance may be lower or higher than performance data quoted. The investment return and principal value of an investment in the Fund will fluctuate so that an investor's shares, when redeemed, may be worth more or less than their original cost. The average annual total returns assume reinvestment of income, dividends and capital gains distributions and reflect changes in net asset value. You should note that the James Advantage Funds are professionally managed mutual funds while the indices are unmanaged, do not incur expenses and are not available for investment.
| Ticker | JMCRX |
|---|---|
| 06/30/2026 | 6.92% |
| 05/31/2026 | -0.95% |
| 04/30/2026 | 7.73% |
| 03/31/2026 | -1.55% |
| 02/28/2026 | 0.89% |
| Ticker | JMCRX |
|---|---|
| 06/30/2026 | 14.10% |
| 03/31/2026 | 6.13% |
| 12/31/2025 | 1.26% |
| 09/30/2025 | 6.24% |
| 06/30/2025 | 7.92% |
| Ticker | JMCRX |
|---|---|
| 12/31/2025 | 4.37% |
| 12/31/2024 | 5.97% |
| 12/31/2023 | 31.72% |
| 12/31/2022 | -17.30% |
| 12/31/2021 | 36.24% |
| Financials | 25.20% |
| Information Technology | 15.40% |
| Industrials | 14.30% |
| Health Care | 12.10% |
| Consumer Discretionary | 8.80% |
| Total as % of Fund | 75.80% |
|---|---|
| Finance/Rental/Leasing | 12.30% |
| Pharmaceuticals: Major | 5.60% |
| Electronic Equipment/Instruments | 5.00% |
| Regional Banks | 4.80% |
| Industrial Machinery | 4.50% |
| Total as % of Fund | 32.20% |
|---|---|
| Enova International Inc | 6.80% |
| iShares Micro-Cap | 5.30% |
| Nova Ltd | 5.00% |
| Merchants Bancorp Ind Com | 3.50% |
| Ingles Market Inc | 2.90% |
| Ofg Bancorp | 2.80% |
| PC Connection Inc | 2.70% |
| FAMC | 2.70% |
| United States Lime & Minerals Inc | 2.50% |
| Modine Manufacturing Co | 2.50% |
| Total as % of Fund | 36.70% |
|---|---|
| United States | 100.00% |
| Canada | 0.00% |
| 0 | 0.00% |
| Total as % of Fund | 100.00% |
|---|---|
Holdings are subject to change without notice.
Current and future portfolio holdings are subject to risk.
| Ticker | JMCRX |
|---|---|
| Inception Date | 07/01/2010 |
| Cusip | 470259813 |
| Total Net Assets as of 06/30/2026 ($mil) | $31.90 |
| Price/Earnings Ratio (12m trailing) | 17.76 |
| Price/Book Ratio | 2.12 |
| Weighted Average Market Capitalization ($mil) | $4,200.4 |
| Median Market Capitalization ($ mil) | $2,024.2 |
| Total Number of Equity Issues | 73 |
| Total Number of Debt Issues | - |
| Portfolio Turnover Rate (annualized as of Fiscal Year-End 11/01/2025) | 6.00% |
| JMCRX | |
|---|---|
| Management Fee | 1.46% |
| Distribution (12b-1) Fee | 0.00% |
| Other Expenses | 0.04% |
| Acquired Fund Fees and Expenses (AFFE) | 0.00% |
| Total Annual Fund Operating Expenses | 1.50% |
0.74
Beta
0.69
R-Squared
19.83
Standard Deviation
0.71
Sharpe Ratio
| EX-Date | Payable Date | Dividend Type | JMCRX Dividend Amount | JMCRX Reinvestment Price |
|---|---|---|---|---|
| 12/05/2025 | 12/08/2025 | Long Term Cap Gain | $0.2265 | $22.00 |
| 12/04/2025 | 12/05/2025 | Est. Long Term | $0.2222 | $22.28 |
| 12/05/2024 | 12/06/2024 | Long Term Cap Gain | $0.2643 | $23.05 |
| 12/05/2024 | 12/06/2024 | Short Term Cap Gain | $0.0423 | $23.05 |
| 12/28/2022 | 12/28/2022 | Income | $0.0921 | $15.42 |
| 12/07/2022 | 12/07/2022 | Long Term Cap Gain | $1.3419 | $16.26 |
| 12/29/2021 | 12/30/2021 | Income | $0.0099 | $20.81 |
| 12/08/2021 | 12/09/2021 | Long Term Cap Gain | $0.7841 | $20.20 |
| 12/29/2020 | 12/30/2020 | Income | $0.0842 | $15.62 |
| 12/27/2019 | 12/30/2019 | Income | $0.0388 | $16.53 |
| 12/09/2019 | 12/10/2019 | Long Term Cap Gain | $0.5058 | $16.44 |
| 12/07/2018 | 12/10/2018 | Long Term Cap Gain | $0.9068 | $14.13 |
| 12/28/2017 | 12/29/2017 | Income | $0.0561 | $17.40 |
| 12/05/2017 | 12/06/2017 | Long Term Cap Gain | $1.2884 | $17.25 |
| 12/29/2016 | 12/30/2016 | Income | $0.0000 | $18.15 |
| 12/30/2015 | 12/31/2015 | Income | $0.0138 | $15.29 |
| 12/30/2014 | 12/31/2014 | Income | $0.0236 | $14.74 |
| 12/04/2014 | 12/05/2014 | Long Term Cap Gain | $3.4509 | $14.31 |
| 12/04/2014 | 12/05/2014 | Short Term Cap Gain | $0.0000 | $14.31 |
| 12/30/2013 | 12/31/2013 | Income | $0.0147 | $17.09 |
| 12/28/2012 | 12/31/2012 | Income | $0.1368 | $11.45 |
| 12/29/2011 | 12/30/2011 | Income | $0.0000 | $10.81 |
| 12/01/2011 | 12/02/2011 | Short Term Cap Gain | $0.0525 | $10.40 |
| 12/01/2011 | 12/02/2011 | Long Term Cap Gain | $0.0035 | $10.40 |
| 03/30/2011 | 03/31/2011 | Income | $0.0000 | $12.24 |
| High | $23.01 | 12/11/2025 |
| Low | $17.36 | 04/08/2025 |
| High | $26.87 | 06/30/2026 |
| Low | $25.11 | 06/05/2026 |
| JMCRX | Prospectus | Annual | Semi-Annual | SAI | Fact Sheet |
James Investment Research, Inc. is registered with the U.S. Securities and Exchange Commission (SEC) under the Investment Advisers Act of 1940. The information and opinions on this website are for general information only, based on sources we consider reliable, but cannot guarantee its accuracy. It should also not be regarded as a solicitation to buy or sell any securities mentioned. Moreover, no client or prospective client should assume that any such discussion serves as the receipt of, or replacement for, personalized financial advice, as it does not take into consideration your unique financial situation, goals, or requirements.
Investing involves risk, including the loss of principal. Past performance is no guarantee of future results.
James Advantage Funds are offered only to US citizens and residents and any information on the website is intended solely for that purpose. Nothing on this website should be considered a solicitation to buy or an offer to sell any James funds in any jurisdiction where offer or solicitation would be unlawful under the securities laws of such jurisdiction. For international investors, please see Institutional.
Small and Micro Cap investing involve greater risk not associated with investing in more established companies, such as greater price volatility, business risk, less liquidity and increased competitive threat. Fund holdings and sector weightings are subject to change without notice. Past performance is no guarantee of future results.
The James Advantage Mutual Funds are distributed by Ultimus Fund Distributors, LLC (Member FINRA) Private and separately managed accounts and related investment advisory services are provided by James Investment Research, Inc., a federally registered investment advisor. Ultimus Fund Distributors, LLC is not affiliated with James Investment Research, Inc.
You should carefully consider the investment objectives, potential risks, management fees, and charges and expenses of the Fund before investing. The Fund's prospectus contains this and other information about the Fund, and should be read carefully before investing. You may obtain a current copy of the Fund's prospectus by calling 1-800-995-2637 or click here to view or download a prospectus online.