
Market Recap
In 2023, consumer sentiment was dampened by regional bank failures, geopolitical tensions, and political maneuvering in the United States. However, a strong turnaround occurred in the final weeks of the year, with the S&P 500 Index surging by over 16% from late October to December. This broad-based rally across both stock and bond markets significantly boosted portfolios, culminating in an exciting conclusion to the year.
The optimism surrounding the economy played a key role in extending the year-end rally. It all began in late October when a substantial uptick in economic growth prospects sparked a robust performance in portfolios throughout November. In December, the Federal Reserve (Fed) signaled the end of its tightening cycle, leading to lower interest rates and further prolonging the rally.
One of the driving forces behind this market enthusiasm was the increased likelihood that the United States would avoid a recession in the short term. Nevertheless, this rally also exposed the markets to heightened sensitivity and the potential for increased volatility as economic expectations and central bank policies shift.
The broad-based rally generated remarkable returns across various asset classes within a short time frame. While a few mega-cap stocks dominated much of 2023, previously struggling markets joined the recent rally. Furthermore, asset classes that had been weighing down portfolios throughout the year surged to the forefront in an impressive manner.
For instance, U.S. small-cap stocks, which had been trailing all other asset classes at the end of October with a nearly 5% year-to-date drop, made a remarkable comeback by returning more than 24.2% in the last two months of the year, seizing the lead. The Russell 3000 Index, a broad measure of the stock market, returned 17.3% over the same period, with economically sensitive small- and mid-cap stocks performing particularly well.
U.S. investment-grade bonds also saw a brighter outlook. With interest rates for long-term Treasury bonds falling from the 5% range in October to below 4% by year-end, this asset class delivered 8.1% return over the last two months. However, it’s worth noting that despite this short-term success, the asset class has dragged down overall portfolio returns over longer timeframes due to higher interest rates compared to two – three years ago.
Throughout January, three pivotal data points have emerged as crucial indicators of the U.S. economic landscape: inflation as reflected in the Personal Consumption Expenditures (PCE) Price Index, economic growth as indicated by Gross Domestic Product (GDP) figures, and the Federal Reserve’s response in terms of interest rate decision.
Focusing on economic growth, recent data underscores the U.S. economy’s resilience, particularly in the context of a potential soft landing. Notably, the annualized GDP growth for the fourth quarter registered at 3.3%, surpassing the anticipated 2.0%. This marks the fifth consecutive quarter where growth has exceeded the trend range of 1.5% to 2.0%, despite the dual challenges of rising interest rates and persistent inflation. The GDP, a comprehensive measure of economic activity, rose at this rate in the fourth quarter, representing a slight deceleration from the 4.9% seen in the third quarter of 2023. However, the U.S. economy has consistently outperformed expectations, with the last two quarters showing robust growth rates of 4.9% and 3.3%. This growth has been fueled by strong consumer spending, which grew by 2.8%, and supported by government spending, business investment, and inventory expansion. Despite the upward pressure from interest rates, the economy has shown remarkable tenacity, with little indication of an impending recession. The full-year GDP for 2023 expanded by 3.1%, easing concerns about a downturn. Additionally, the S&P Purchasing Managers Index (PMI) for both services and manufacturing sectors indicated expansion in January, with manufacturing PMI reaching its highest point since October 2022.
In terms of inflation, the Federal Reserve closely monitors the PCE Price Index, with core PCE (excluding food and energy for reduced volatility) showing a year-on-year increase of 2.9% in December. This rate represents a decrease from the previous month’s 3.2% and is the lowest since March 2021, though still above the Fed’s 2.0% target. The PCE Index saw a modest 0.2% month-to-month rise in December, concluding the year with an annual rate increase of 2.9%, significantly lower than 2022’s figures.
These data points suggest that the U.S. economy was gaining momentum as it entered 2024, with signs of economic growth acceleration and moderating inflation. This combination of strong growth and easing inflation, often termed a “Goldilocks” scenario, bodes well for financial markets and may lead to a decrease in interest rates. Evidence of this positive outlook is seen in the S&P 500 Index reaching new highs and a decline in the 2-year Treasury yield to around 4.35%.
As for the Federal Reserve’s stance, it remains a crucial factor for both the markets and the economy in 2024. At the first Federal Open Market Committee (FOMC) interest rate decision of the year, held on January 31, 2024, the Federal Reserve maintained its interest rate between 5.25% and 5.50% for the fourth consecutive meeting. This indicates a potential future cut but does not commit to an immediate action. Fed Chair Jerome Powell emphasized the need for continued evaluation of economic data before adjusting rates. He specifically focused on achieving a sustainable inflation rate closer to 2%. Powell suggested that, despite recent positive trends in inflation, more consistent data is required to build confidence in making rate adjustments. He clarified that a rate cut in March is unlikely without more conclusive evidence of sustained inflation improvement. The Fed also discussed the future pace of reducing their balance sheet, known as quantitative tightening, and plans to have a detailed conversation on this in their next meeting.
Lastly, U.S. consumer sentiment has shown a notable improvement, recording the largest two-month gain since 1991. The University of Michigan’s January Consumer Sentiment Index climbed to 78.8, reflecting increased consumer optimism about ongoing inflation moderation.
So far this year, the stock market rally has continued relentlessly, reaching a new all-time high on January 29, 2024, despite a challenging start to the month. This rally, however, is distinct from last year’s more broadly based surge. Currently, it is largely fueled by major technology firms, particularly the ‘Magnificent 7’ (Amazon, Apple, Google, Meta, Microsoft, Nvidia, and Tesla), which are poised to gain substantially from the ongoing artificial intelligence (AI) revolution. This trend has been so pronounced that The Wall Street Journal headlined an article “The S&P 500 Rallied to Records on the Back of Just One Sector,” underscoring that among the index’s 11 sectors, only Information Technology has managed to hit an all-time high.
The disparity in the rally’s breadth is evident in the performance of different versions of the S&P 500 Index. The equal-weight S&P 500 Index, which gives similar weight to all stocks regardless of their market size, declined by 0.82% in January. In contrast, the market capitalization-weighted S&P 500 Index, where larger companies have a bigger influence, increased by 1.68%, showcasing the significant impact of the largest-cap stocks. NVIDIA, at the forefront of the AI revolution, has experienced a significant surge in its value, with an impressive 24.24% increase since the start of the year. This remarkable growth has positioned it as the top performer within the S&P 500 Index for 2024 year-to-date.
This concentration of gains in a few large stocks presents a risk. Should any of these dominant large-cap companies fall short of earnings expectations, it could potentially trigger a broader market downturn. The current rally’s reliance on a limited number of high-performing stocks creates a fragile market situation that investors should watch closely.
Mirroring the trend from the end of 2023, growth stocks have continued to outperform value stocks by a significant margin into the new year. The larger stocks, as indicated by the S&P 500 Index, have delivered a return of 1.68% since the beginning of the year. In contrast, small-cap stocks, as represented by the Russell 2000 Index, have faced a decline, with a loss of 3.89%. Notably, the Communication Services sector experienced a robust rally of 4.4%, and the Financial sector also saw considerable growth, advancing by 3.1%. These sectors emerged as the top performers for January. On the other hand, the Real Estate sector observed a decline of 4.8%, and the Consumer Discretionary sector also experienced a downturn, with a 4.4% decrease.
In 2023, bond yields saw notable fluctuations, with the 10-year U.S. Treasury bond reaching a high of 4.99% in October from April’s low of 3.30% and starting the year at 3.87%. Interestingly, it closed the year near its starting point, at around 3.9%, after a significant late-year rally. The 30-year mortgage rates also peaked at 8.9% by October 25, 2023, the highest since 2000. The Bloomberg U.S. Aggregate Bond Index reflected these movements with a 5.7% gain for the year.
As of this writing, the Bloomberg U.S. Aggregate Bond Index has declined by 0.27%, influenced by rising interest rates, with the 10-year U.S. Treasury yield increasing from 3.88% at the end of 2023 to 4.087% currently. Additionally, 30-year mortgage rates have decreased to 6.9% this year, initiating a strong rebound in housing activity. Home builder stocks posted impressive gains in January, reflecting growing confidence in the industry.
Topic of the Month: Earnings
Global stocks, currently trading close to peak levels, are approaching a challenging period as decelerating economic growth begins to impact earnings projections. Anticipating substantial revenue increases in a context where GDP growth is expected to slow down presents an uncommon disconnect. Earnings are now expected to fall short, with profit margins facing pressure from increasing wages and the delayed effects of higher interest rates. Currently, the market seems to be reacting positively to weaker economic data, interpreting it as a precursor to more rate cuts and lower bond yields. However, this trend is likely to reverse at some point because the weakness in some economic surveys has not yet been reflected in profit margins or revenues.
The Magnificent Seven Again
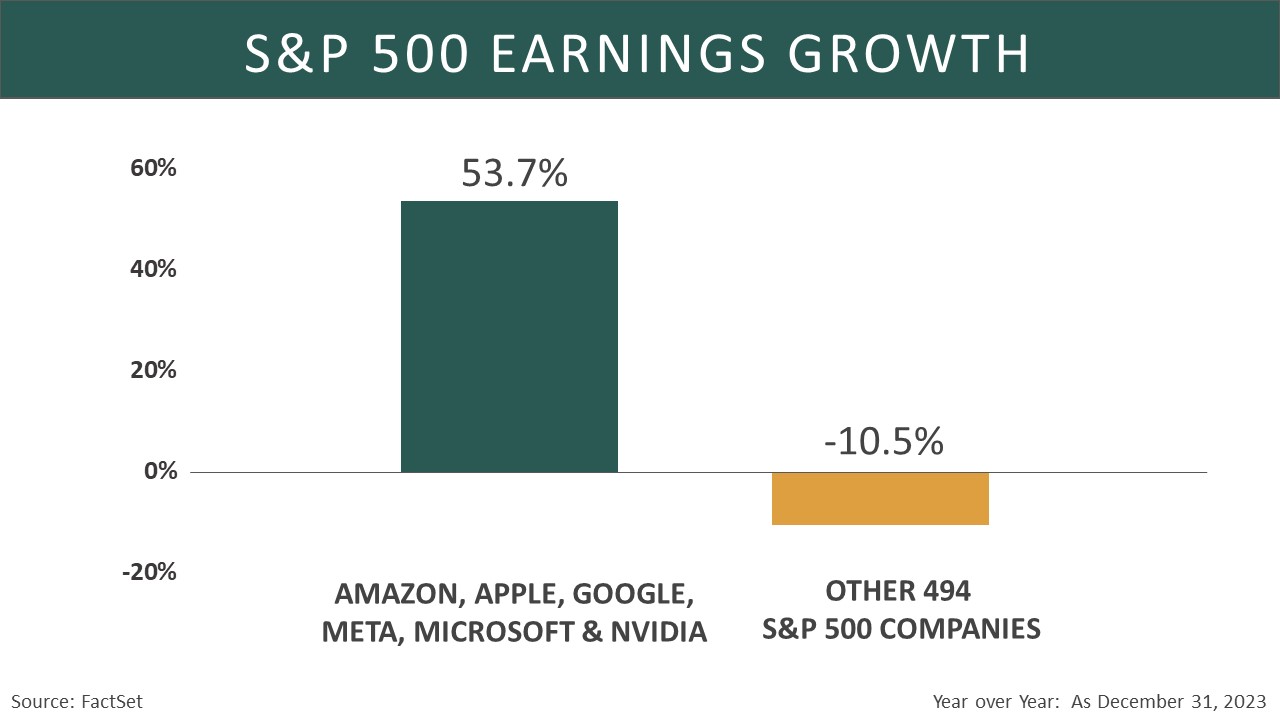
The ‘Magnificent 7’ continue to be the driving force behind not only the stock market’s record highs but also the upward movement in the S&P 500 Index’s earnings. FactSet reports that six out of these seven companies, excluding Tesla, are poised to be the primary drivers of the S&P 500 Index’s year-over-year earnings growth for the fourth quarter of 2023. These six companies are collectively projected to achieve a remarkable 53.7% increase in year-over-year earnings for Q4 2023. Excluding their contribution, the blended earnings (a combination of actual and estimated results) for the other 494 companies in the S&P 500 Index are expected to see a decline of 10.5% for the same quarter. As a result, the overall blended earnings for the S&P 500 Index in Q4 2023 are estimated to show a decrease of 1.4%, which is not consistent with additional new highs in this index.
The FactSet report highlights that four out of the six companies – NVIDIA, Amazon, Meta, and Alphabet – are expected to be the foremost contributors to the S&P 500 Index’s earnings growth for the first quarter of 2024. Collectively, these four companies are predicted to report a significant year-over-year earnings increase of 79.7% for Q1 2024. If these four are excluded, the rest of the 496 companies in the S&P 500 are projected to achieve a much more modest year-over-year earnings growth of just 0.3% for the same quarter.
Earnings Score Card
With only a quarter of the S&P 500 Index’s market capitalization having reported as of this writing, a recurring theme is evident: earnings are surpassing expectations, yet future estimates are being revised downwards. The earnings for Q4 2023 are somewhat lackluster, with the overall blended earnings for the S&P 500 Index in this period estimated to decline by 1.4%.
Bloomberg’s report highlights this trend, showing that the initial earnings reports for the fourth quarter of 2023 have seen earnings per share (EPS) exceed initial expectations. Specifically, Q4 EPS growth stands at 2.27%, surpassing the forecasted 1.18% (or 5.96% vs. 4.55% when excluding the Energy sector). Notably, the Financial Services sector has defied expectations by reporting a 1.8% growth, in contrast to the anticipated 2.2% decline. Similarly, the Consumer Staples and Industrial sectors have reversed their expected downward trends.
However, the Energy and Healthcare sectors are experiencing significant declines, with projected drops of 31.4% and 20.9%, respectively. This trend is noteworthy as nearly 80% of companies have reported EPS above estimates, a figure slightly higher than the post-Covid average of 78.6% and substantially above the long-term average of 64.9% since 1992.
Further expanding on this analysis, Bloomberg notes that this earnings season has seen revenue growth surpassing expectations, mainly due to unexpected gains in the Communications Services sector. This sector, along with Healthcare, leads the growth and is expected to report year-over-year increases of 5.8% and 5.3%, respectively. In stark contrast, sectors reliant on commodities, such as Energy and Basic Materials, are facing their fourth consecutive quarter of revenue decline, with reductions of 10.3% and 5.5%, respectively. Interestingly, just over half of the companies have exceeded revenue projections, which aligns with the long-term average of 52.8% since 2009.
Margins
According to Bloomberg, profit margins are aligning with expectations. The net income and operating margin estimates for Q4 are tracking slightly above pre-season predictions, at 11.78% (compared to the forecasted 11.72%) and 14.35% (versus the pre-season estimate of 14.55%), respectively. However, these figures are still lagging the previous year’s margins, which were 11.96% and 14.88% for the S&P 500 Index. Interestingly, a higher than usual proportion of companies are surpassing net income and operating margin estimates compared to the averages of the past two years. The Information Technology and Utilities sectors are particularly noteworthy for their margin performance. They have not only outdone their preseason forecasts but have also shown margin expansion compared to last year. In contrast, the Energy and Healthcare sectors have underperformed in both respects.
Guidance
‘Guidance’ refers to a company’s projected or estimated EPS shared in advance of their reporting actual results.
FactSet reports that within the S&P 500 Index, 23 companies have provided EPS guidance for Q1 2024. Out of these, 14 companies have issued guidance indicating a potential decrease in EPS, while 9 companies have provided positive EPS projections. This results in 61% (14 out of 23) of the companies issuing negative EPS guidance for Q1 2024, slightly above the five-year average of 59% but below the ten-year average of 63%.
For the current fiscal year (FY 2023 or FY 2024), 268 companies in the S&P 500 Index have issued EPS guidance. Among these, 136 have indicated negative EPS guidance and 132 have suggested positive EPS guidance, leading to a total of 51% (136 out of 268) issuing negative guidance.
Opportunities & Challenges
The current market optimism is fueled by several key bullish factors, including the Federal Reserve’s dovish stance, the possibility of a soft-landing, better financial conditions, stable earnings forecasts for 2024, corporate strategies to protect profit margins, and a substantial $1.3 trillion inflow into money market funds over the past year. However, bearish indicators are also present, such as concerns over an overbought market, the residual impact of the Federal Reserve’s strict policies, ongoing fears of a recession despite recent optimism for a soft landing, risks associated with declining inflation and earnings, and escalating geopolitical tensions influencing oil prices, particularly in the Middle East. The path to the Fed’s 2% inflation target remains uncertain, with the final stages potentially more challenging than in 2023. Furthermore, increasing great-power rivalry may affect global trade, investment, and risk premiums, and political uncertainty is amplified by major upcoming elections worldwide.
A recent challenge is the rising risk to supply chains due to disruptions in the Red Sea. Attacks there have led major shipping companies to reroute around Africa, increasing shipping costs and transport time. These disruptions are driving up shipping costs and could impact consumer prices if they continue, though their effect is likely to be less severe than the supply chain issues of 2021. Since then, company inventories have grown, shipping capacity has expanded, and consumer demand for goods has moderated.
Conclusion
In summary, the financial landscape in 2023 and early 2024 has been marked by significant shifts and notable trends. Despite challenges like regional bank failures, geopolitical tensions, and political maneuvering in the United States, the market experienced a strong rebound, with the S&P 500 Index surging over 16% from late October to December 2023. This rally was driven by optimism surrounding economic growth, a dovish stance from the Federal Reserve, and the likelihood of the U.S. avoiding a near-term recession.
Major tech companies, particularly the ‘Magnificent 7’, played a key role in driving market gains and the S&P 500 Index’s earnings. However, there was a noted disparity in the rally’s breadth, with large-cap stocks significantly outperforming small-cap stocks. Bond markets also experienced fluctuations, with bond yields and mortgage rates showing notable changes.
Earnings reports for Q4 2023 have generally exceeded expectations, but there’s a trend of downward revisions in future estimates. While certain sectors like Information Technology and Utilities have performed well, others like Energy and Healthcare have seen declines. Corporate guidance for Q1 2024 indicates a mixed outlook, with many companies projecting negative EPS growth.
Overall, the market is navigating through a phase of cautious optimism, balancing bullish factors, such as improved financial conditions and stable earnings forecasts, against bearish indicators like the potential for recession and geopolitical uncertainties. Supply chain risks, especially due to disruptions in the Red Sea, add another layer of complexity to the economic outlook. As we move further into 2024, investors are closely watching the Federal Reserve’s policies, global political developments, and sector-specific performances to gauge the direction of the market.
Sincerely,
The James Research Team
This material is distributed by James Investment Research, Inc. and is for information purposes only. No part of this document may be reproduced in any manner without the written permission of James Investment. It is provided with the understanding that no fiduciary relationship exists because of this report. Opinions expressed in this report are the opinions of James Investment and are subject to change without notice. James Investment assumes no liability for the interpretation or use of this report. Investment conclusions and strategies suggested in this report may not be suitable for all investors and consultation with a qualified investment advisor is recommended prior to executing any investment strategy. Past performance is not indicative of future results. All rights reserved. Copyright © 2023 James Investment.