
Monthly Recap
July was a strong month for stocks. The S&P 500 Index rose by 3.2%, while the tech-heavy NASDAQ 100 Index increased by 3.8%. After seeing narrow leadership in March and May, a broader range of stocks joined the rally in June. This broadening trend continued into July. Currently, over 78% of sub-industries exhibit a bullish trend, identified when their 50-day average price is higher than the 200-day average price. This serves as a measure of market breadth. Historically, such readings have indicated favorable returns for the S&P 500 in subsequent periods.
The small-cap Russell 2000 Index rose by 6.1% in July, building on its 8.1% increase in June. The continued participation of these smaller cap names bolsters the overall health of the Bull Run. Notably, small caps have outperformed their larger counterparts for two consecutive months.
In terms of sectors, the cyclical players – Financials and Industrials – are also participating in the rally. Meanwhile, the secular growth sectors, namely Technology, Communication Services, and Consumer Discretionary, have retained their leadership positions. However, these sectors appear overbought and may be due for a pause. If the economy remains resilient throughout the second half of the year, we might witness a shift in leadership towards cyclical sectors in the coming months.
As for the bond market, Treasury yields experienced a spike at the beginning of July, only to conclude the month slightly above where they started. The U.S. 10-year Treasury kicked off the month at 3.8%, surged to 4.1%, and ended the month back at 3.9%. This sideways movement in the bond market is a result of the interplay between easing inflation and enduring economic growth. Inflation receded to 3% in June, while the second quarter Gross Domestic Product (GDP) grew 2.4%. The economy continues to draw support from a robust job market and resilient consumer spending.
A Slowing Economy Ahead
The prospects for a soft landing—where the economy continues to progress at a modest growth rate while inflation returns and stabilizes at the Federal Reserve’s (Fed) target of 2%—are improving. July brought positive developments on both the economic growth and inflation fronts. Consumer spending remains robust, though it is beginning to temper. June’s retail sales fell short of expectations and inflation adjusted retail sales are contracting year-over-year. The ongoing decline in the balance sheets of lower-income households could amplify this weakening trend.
However, companies are holding onto their workforce due to the challenges they faced with labor shortages during the COVID-19 pandemic. This strategy is bolstering the labor market, providing consumers with a strong safety net for the time being. Many CEOs are retaining their talent, prepared to navigate even through a mild recession. As a result, the economy is poised to sustain its momentum in the near term. Indications of this resilience might emerge in August, potentially displaying a more robust GDP figure and a more favorable job report, in our assessment.
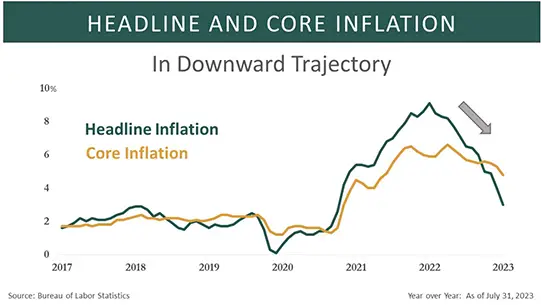
Downward Inflation Trajectory
Inflation is also exhibiting a downward trend. Favorable comparisons with the previous year and declining commodity prices are contributing to a decrease in headline inflation measures. Despite this apparent disinflationary path, core measures, which exclude food and energy, remain high. Several factors are influencing this trend. First, as
highlighted in our quarterly outlook at the end of June, shelter inflation is expected to significantly decrease in the coming months. Real-time rent and housing prices are showing a year-over-year deflation. This shift is a crucial positive driver of inflation since shelter costs account for 30% and 50% of the headline and core measures, respectively.
Second, an inventory glut in the goods sector persists, which is likely to further contribute to goods deflation in inflation measures. Third, the labor market is regaining balance as labor participation continues to improve and job openings decrease. This balance may result in slower wage growth and, consequently, lower aggregate demand. This, in turn, can result in a decrease in super core inflation, a measure that excludes costs associated with housing, food, and energy. Many Fed officials regard a lower figure for this metric as an indicator of success.
In conclusion, inflation is likely to maintain its downward trajectory in the months ahead, potentially defying expectations to the downside. However, it could stabilize at a level between 2 and 3%—an outcome the Fed may consider a victory.
Fed Nearing The End Of Its Hiking Cycle
The recent 0.25% rate hike by the Fed, enacted on July 26, is likely to be the final one of its kind, as expected progress in managing inflation throughout August, and particularly September, could mark the end of this hiking cycle.
The Fed is widely expected to maintain the Federal Funds rate at 5.5% for several months to ensure that inflation is under control. This scenario is particularly likely if we start to see signs of cracks in the labor market, such as an increase in initial jobless claims.
Such an uptick could imply that the delayed effects of previous Fed rate hikes are beginning to impact the labor market, thus slowing wage growth—a key driver of rising prices through robust aggregate demand. We cannot rule out a potential final rate hike in September or November, especially if core inflation remains strong. However, this is not our baseline scenario.
Perhaps most importantly, the fact that the Fed’s cycle of rate hikes is nearly complete suggests the market might be anticipating a pivot to rate cuts sometime in 2024.
Earnings Growth Expectations
The projection for the S&P 500 earnings for the second quarter (Q2) is at -9.0%, with signs of improvement in subsequent quarters. This suggests that Q2’s earnings growth may represent the nadir of this earnings recession.
However, profit margins are being undermined as revenue growth declines due to diminishing pricing power concurrent with falling inflation. High inflation was a primary catalyst for larger revenue growth in 2022, so a reduction in inflation poses a challenge to revenue as most companies halt price increases once their input costs stabilize. As competition re-emerges, pricing power starts to wane.
In response, companies across various industries are launching cost-cutting campaigns and productivity initiatives to preserve margins. These factors, combined with the emerging narrative of an economic soft landing and the easier comparisons to the previous year, are making the analyst community more optimistic about the future earnings outlook.
Nevertheless, much of this year’s stock market rally has been driven by the expansion of valuation multiples. Thus, companies must deliver robust earnings to justify these demanding valuations, particularly for the mega cap technology companies.
A Choppy Bond Market
Throughout 2023, the bond market has remained within a defined range. Serving as a barometer for the overall bond market, the 10-year U.S. Treasury yield has oscillated between 3.3% and 4.1% – a rather narrow range. Yields have edged towards the higher end of this range in response to data suggesting persistent inflation or robust economic growth, while they have receded upon indications to the contrary. A decline in bond yields corresponds to a rise in bond prices.
The bond market is currently characterized by significant uncertainty, as highlighted by the elevated levels of the Treasury Market Volatility Index (MOVE). This is notable, especially given the marked decrease in the Stock Market Volatility Index (VIX). To gauge how this uncertainty might unfold, it’s essential to evaluate the likely directions of both inflation and economic growth in the near future. Our projection points to a decrease in both of these areas in the months ahead.
We foresee a continued slowdown in economic growth as consumer spending and labor market activity cool, and as the manufacturing sector continues to grapple with challenges. In addition, we believe, as outlined earlier, that inflation is gradually and steadfastly receding to a level that would lead the Fed to halt rate hikes, barring any geopolitical surprises that might drive up commodity prices.
Given this forecast of modest, albeit non-negative economic growth, and the prospect of headline inflation landing between 2-3% by year’s end, we advise buying into any bond sell-off. Additionally, with yields currently at elevated levels, bonds now present a viable alternative to riskier assets such as stocks. From a risk-reward standpoint, any increase in yields presents a buying opportunity for long-term investors, in our view.
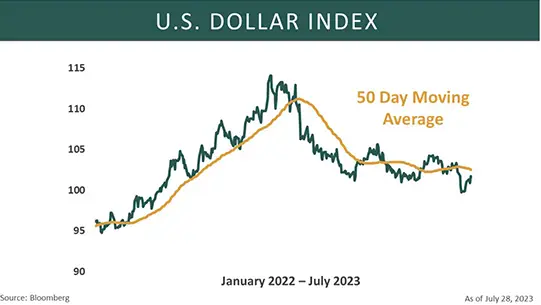
Topic of the Month – The Dollar
The U.S. Dollar has been on a downward trend for most of the year due to several factors. First, prevailing market expectations of a soft landing indicates the Federal. Reserve is approaching the end of its interest rate hikes. Additionally, a decline in inflation has prevented a rise in bond yields.
Moreover, foreign central banks across the globe have begun to raise interest rates, which is likely to exert further downward pressure on the U.S. Dollar. The real yield curve, a reliable leading indicator for the U.S. Dollar, has exhibited a negative trend, suggesting a persistent downward shift for the currency. Last summer, the real yield curve peaked a month or two prior to the U.S. Dollar’s peak in September. Since then, it has been aggressively flattening due to the Federal Reserve’s interest rate hikes and the ensuing decrease in the Consumer Price Index (CPI). These developments are expected to weaken the U.S. Dollar and maintain its bearish trend.
In addition, the strength of both the Japanese Yen and Euro have significantly contributed to the depreciation of the U.S. Dollar. A major reversal of its trend is unlikely if U.S. inflation continues to fall, maintaining pressure on the real yield curve and the Dollar.
Expectations for heightened volatility in the U.S. Dollar are likely, as the factors that once supported the U.S. Dollar’s strength in 2022 have now reversed. Market sentiment has shifted, and there is a growing consensus that the Federal Reserve will ease its monetary policy due to signs of disinflation.
In conclusion, the U.S. Dollar is facing weakness due to a combination of factors, including market expectations of a soft landing, falling inflation, lower bond yields, foreign
central banks raising rates, and the negative trajectory of the real yield curve. While some of the recent weakness can be attributed to other currency-related factors, most of it is driven by U.S. monetary policy.
Currency Impact on Companies
The depreciation of the Dollar presents both benefits and drawbacks to the United States. On the upside, a weaker dollar bolsters the competitiveness of U.S. exports in foreign markets, thereby enabling American firms to bolster their revenue. Domestically, these firms also gain a competitive edge due to their lower prices when compared to more expensive imports. Additionally, the lower cost of operating in the country attracts foreign direct investment, further supporting job creation by foreign companies.
However, a weaker Dollar does present certain challenges. For one, consumers might see higher prices for imported goods and services, thereby affecting their purchasing power. In addition, rising raw material costs and other inputs could dent the bottom lines of U.S. companies. A less jamesinvestment.com Page 4 of 4 competitive price landscape from imports may also result in U.S. products becoming pricier, potentially contributing to increased domestic inflation. Another point of concern is the heightened cost of foreign investment for both U.S. companies and individual investors. If the weakened currency prompts foreign investors to pull out their capital, it could drive up interest rates in the U.S. For policymakers, striking a balance between these pros and cons is pivotal to ensuring the nation’s economic stability and growth.
Equity investors should take note of their exposure to the U.S. Dollar and its potential impact on revenues. Approximately 40% of the S&P 500’s revenues are generated from abroad, with the Information Technology and Materials sectors leading the way. Specifically, these sectors derive 59% and 53% of their revenues, respectively, from overseas. In 2022, the U.S. Dollar strengthened against most foreign currencies, largely due to the Federal Reserve’s aggressive interest rate hikes. This scenario dramatically influenced revenues for U.S. companies, consequently affecting their stock prices. Companies included in the S&P 500 Foreign Revenue Exposure Index – companies with higher-than-average revenue exposure to regions outside the U.S. – suffered a loss of 23.1%, significantly more than the 8.9% loss observed in the S&P 500 U.S. Revenue Exposure Index.
However, a shift occurred since the Dollar’s peak in late 2022. From January 2023 to the end of July, we observed a reversal in leadership. Companies with foreign exposure are now in the lead, experiencing a gain of 30.8% compared to a slight gain of 3.1% for companies with predominantly domestic exposure.
In the near-term, we anticipate heightened volatility, and given the Dollar’s current short-term oversold position, some appreciation wouldn’t be surprising. Yet, factors such as subdued economic growth, the Fed nearing the end of its rate-hiking cycle, and pressure from foreign central banks are likely to maintain the Dollar’s longerterm downward trajectory. This trend will likely benefit companies generating revenue from overseas, while posing challenges for importers and companies with high domestic sales.
Conclusion
July witnessed robust stock performance with broad market participation, notably from small-cap companies. Despite the prospects of an economic slowdown, workforce retention and sustained consumer spending are likely to maintain economic resilience. Concurrently, a decline in inflation is expected due to various contributing factors like reduced shelter costs and an inventory surplus in the goods sector. While Q2 seems to represent the trough for earnings growth, the upcoming quarters could see improvement, despite challenges posed by declining inflation and waning revenue growth.
The U.S. Dollar has been declining due to factors like a predicted soft landing and rising foreign interest rates. Thisdepreciation benefits U.S. exports by making them more competitive and attracts foreign investment, but also raises the cost of imports and may increase domestic inflation. The performance of equity markets has shifted, with companies having significant overseas revenue now outperforming their domestic-focused counterparts in 2023. In the short-term, the Dollar may experience volatility, but its longer-term downward trend is likely to persist given various economic indicators.
Given the rising likelihood of a soft landing, improved investor sentiment, and declining inflation, it could be advantageous to shift focus towards cyclical and small-cap companies. With the Fed approaching the end of its rate-hiking cycle, diversifying into bonds may offer strategic benefits. Furthermore, we believe companies with substantial overseas revenues should continue to gain from a depreciating Dollar. Yet, our outlook remains subject to notable risks, including geopolitical tensions and the potential for unexpected inflation spikes.
Sincerely,
The James Research Team
This material is distributed by James Investment Research, Inc. and is for information purposes only. No part of this document may be reproduced in any manner without the written permission of James Investment. It is provided with the understanding that no fiduciary relationship exists because of this report. Opinions expressed in this report are the opinions of James Investment and are subject to change without notice. James Investment assumes no liability for the interpretation or use of this report. Investment conclusions and strategies suggested in this report may not be suitable for all investors and consultation with a qualified investment advisor is recommended prior to executing any investment strategy. Past performance is not indicative of future results. All rights reserved. Copyright © 2023 James Investment.