
An Indepth Forecast Of The Year 2023
Third Quarter Recap
In 2023, the stock market experienced a dramatic rise, especially in the first half of the year, recouping much of the 2022 pullback. While we have not yet reached the highs set in the first week of 2022, the markets are demonstrating resilience. Year-to-date, the standout performers have been large-cap technology stocks, especially those in the Artificial Intelligence (AI) sector. Artificial Intelligence remains a focal point for investors because of the transformative potential of machine learning. As AI algorithms evolve and become more sophisticated, companies that integrate this technology are poised to benefit from enhanced efficiency, cost savings, and innovative product offerings.
Owing to these potential advances, the S&P 500 Index has risen 13.1% year-to-date. In contrast, the smaller stocks of the Russell 2000 Index saw a more modest increase of 2.5% during the same period. Historically, stocks face their most challenging quarter between July and September. This year is consistent with that pattern, as the S&P 500 Index fell 3.3%, while smaller issues in the Russell 2000 Index declined 5.1% during the quarter.
The Energy sector emerged as the standout, registering a substantial gain of 12.2%, primarily driven by rising oil prices. Sectors sensitive to interest rates, like Real Estate and Utilities, trailed over the past three months. Of all sectors, Utilities, traditionally seen as defensive, experienced the steepest decline, dropping close to 9.2%.
Inflation has gradually returned to more moderate levels following 11 rate hikes since March 2022. While many factors contributing to the computation of the Consumer Price Index (CPI) and inflation rates have decreased, one major component, oil, is on the rise again. Year-to-date, West Texas Intermediate has risen by 12.3%. Remarkably, it has surged 32.4% just in the current quarter. Earlier this summer, Saudi Arabia opted to reduce their oil output from roughly 10 million barrels per day to around 9 million. This substantial cut, anticipated to persist until 2024, has significantly bolstered oil prices.
Diminished oil supplies have coincided with a rise in demand. This summer, more Americans hit the roads than they did last year, and the demand for air travel also increased. From the onset of summer, the price of oil climbed from around $70 to its current rate of $91. This surge has not only elevated driving costs for consumers; it has also stoked fears of a resurgence in inflation.
Amid concerns of another Federal Reserve Bank (Fed) rate hike, bonds have once again underperformed. The Bloomberg U.S. Aggregate Bond Index, a widely used fixed income benchmark, is on track for its third consecutive year of losses, an unprecedented occurrence. For much of this year, there was a widespread belief that the Fed had concluded its rate hike agenda. However, in light of recent economic developments, the Fed continues to emphasize combating inflation and the possibility of rising rates.
Recently, as the correlation between stocks and bonds has strengthened, the favored diversification strategy of many investors—a portfolio consisting of 60% U.S. stocks and 40% bonds—has faltered. Over the last three months, both the S&P 500 Index and the Bloomberg U.S. Aggregate Bond Index have posted losses, recording declines of 3.0% and 3.1%, respectively.
Market analysts are increasingly discussing the possibility of a U.S. economic ‘soft landing,’ transitioning from growth to slow-growth without tipping into a recession. However, the forecast for international markets, especially China, seems less favorable. Lately, worries about an economic deceleration in the world’s second-largest economy have intensified. Such concerns have significantly impacted the Hang Seng Index, a key indicator of the Chinese stock market, which has declined over 21% from its recent peak in January of this year.
This quarter, most domestic and international assets offered investors few safe harbors as they declined universally. The sole potential refuge seems to be cash, which is currently yielding its highest returns in years.
Economy
The U.S. economy continues its steady progression through its late-cycle phase. The Gross Domestic Product (GDP) is estimated to have grown by around 4% in the third quarter (Q3) of 2023, according to the average of Nowcasting models from the New York Fed, Atlanta Fed, and Bloomberg. This solid growth can be attributed to robust consumer spending over the summer, driven by a still-extremely strong pent-up demand for services.
We believe the economic strength of Q3 could persist into the fourth quarter, though we anticipate a slightly lower growth rate of 1.5% to 2%. The economy benefits from resilient U.S. consumers buoyed by a robust, though moderating, labor market. U.S. consumers maintain strong balance sheets and have capacity for additional leverage, which could prolong this late phase of the economic cycle.
Moreover, according to the Institute of Supply Chain Management (ISM) surveys, manufacturing remains in contraction. However, there are encouraging signs of stabilization and inventory rebuilding. Government spending remains robust, with the Inflation Reduction Act (IRA) and the Creating Helpful Incentives to Produce Semiconductors and Science (CHIPS) Act spurring private investment in manufacturing plants, which in turn generates various secondary demands.
However, moving forward, the economy faces potential risks. Consumer spending, accounting for approximately two-thirds of the economy, may decelerate compared to its pace in the summer months due to several headwinds: 1) the resumption of student loan repayments, 2) the depletion of pandemic-induced savings, particularly among the lower-income cohort, and 3) the delayed impacts of past Fed’s rate hikes on spending.
Labor Market
The labor market has remained notably resilient despite one of the fastest Fed hiking cycles on record. Several factors contribute to this resilience. Chief among them is the significant government stimulus in 2020 and 2021, which resulted in a substantial accumulation of savings by U.S. consumers. This served as a buffer against rising interest rates, ensuring that consumer demand stayed strong. Consequently, the labor market remained robust.
While the labor market remains tight, it is moving toward a better balance. For instance, job openings—a reliable leading indicator of labor trends—are reverting to their typical trend. In March of 2022, there were two job openings for every unemployed individual in the economy. By the end of July this year, this ratio had decreased to 1.4 jobs per unemployed person.
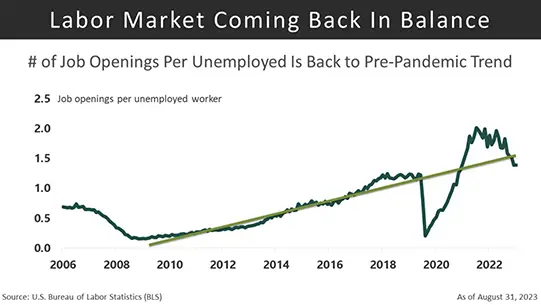
Moreover, the quit rate, a gauge of employees’ perspectives on the labor market, has also declined, echoing a similar trend. Additionally, the average three-month non-farm payroll growth has been moderating. Throughout 2023, the economy has been adding fewer jobs on a monthly basis, and these job figures have seen downward revisions. It’s evident that the job market is moving towards a better balance between labor supply and demand, though it remains historically tight.
U.S Consumers
U.S. consumers ramped up their spending on services over the summer. The Personal Consumption Expenditures (PCE) will likely see a significant uptick compared to the second quarter. Official data reveals that the PCE grew by 2.4% in June and 3.0% in July. While the official figures for August and September are not yet available at the time of writing, credit card data indicates continued robust spending during these months. As such, consumer spending is expected to be the primary driver of strong Gross Domestic Product growth in the third quarter.
As always, there are potential headwinds to consider. Student loan repayments resume on October 1st. Some economists estimate the average payment to hover around $380 per month, a substantial amount that could reduce discretionary spending. While high earners still possess excess savings, the lower-income bracket, which typically has the highest spending propensity, has depleted its surplus savings—a crucial spending source in recent months. Additionally, gasoline prices have surged by 8.6% since the 4th of July. If these prices persist or escalate further due to a further rise in oil prices, they could significantly curtail spending in the fourth quarter.
Overall, despite these headwinds, we anticipate consumer spending will remain robust in the fourth quarter, though perhaps not as pronounced as in the third quarter.
Manufacturing
There are encouraging signs within the manufacturing sector of the economy. The ISM Purchasing Manufacturing Manager Index (PMI) survey hints at stabilization and potential recovery on the horizon. Furthermore, regional Fed surveys are beginning to rebound, corroborating the stabilization indicated by the PMI. It is worth noting that current manufacturing surveys still depict a sector in contraction. However, the data suggests conditions are improving compared to previous months, and we might have witnessed the lowest point of this manufacturing cycle.
Government Spending
The current administration’s industrial policy is promoting an expansionary fiscal approach, which contrasts with the Federal Reserve’s tightening program of rate hikes and balance sheet runoff. Though elevated interest rates have affected interest-sensitive sectors like housing and durable goods, other segments of the economy are reaping the benefits from the phased distribution of funds from the IRA and CHIPS Acts.
For instance, examining the second quarter GDP (the most recent figure available at the time of writing) reveals that nonresidential fixed investment surged by a substantial 7.7% for the quarter, propelled by robust growth in structures and equipment spending. This segment alone contributed 1% to the 2.1% GDP growth in the second quarter, accounting for almost half of the growth.
The phased distribution of funds from the IRA and CHIPS Acts creates multiplier effects across various sectors. These impacts are poised to boost economic growth in the coming years as the U.S. continues to repatriate supply chains and advance the renewable energy transition.
Inflation
Inflation in the U.S. has significantly declined from 9.1% in June 2022 to 3.7% in August 2023. The headline Consumer Price Index is swayed by the volatile energy and food prices. A recent surge in oil prices led to increased costs for gasoline and heating oil, contributing to an uptick in inflation from 3.1% in June 2023 to 3.7% in August 2023. However, when considering core inflation, which excludes energy and food prices, the rate continues its moderating trend — moving from a peak of 6.6% in September 2022 to 4.4% in August 2023, consistently on a downward trajectory.
A potential risk for the fourth quarter is that persistent or escalating energy prices could begin to impact core items. If oil prices maintain their current level or increase further, it could disrupt the disinflationary trend we have observed thus far. Additionally, the impact of easier year-on-year comparisons (the base effect) is diminishing. With the elevated inflation numbers from last summer no longer influencing the annual calculation, any forthcoming moderation in inflation will depend entirely on actual prices rising at a slower pace.
Nevertheless, our baseline scenario anticipates the headline inflation figure remaining steady or potentially increasing if oil prices surge to $100/barrel. Meanwhile, we expect core inflation to continue its moderation, stabilizing around 3.7% by year’s end. The disinflation in shelter and deflation in goods are expected to provide ongoing support to core inflation.
UAW Strike
In the immediate future, economic growth faces headwinds from the United Auto Workers (UAW) strike. Some economists estimate that the UAW strike could shave 0.1% off annualized GDP growth for each week it continues.
While growth is expected to rebound in the quarter following the shutdown, the strike could have a lasting impact in the form of higher car prices. This inflationary effect might arise if the new worker contracts result in increased labor costs for car manufacturers.
Global Economy
While the resilience of the U.S. economy consistently exceeds many economists’ expectations, the situation overseas is less rosy. The Eurozone (EU) grapples with high inflation, and economic growth remains elusive. GDP growth for the EU has been tepid, fluctuating between -0.1% and 0.1%. Forward-looking manufacturing data from Germany, Europe’s powerhouse, hints at a recessionary trend. The country’s ISM Manufacturing New Orders PMI stands at 38, which indicates significant contraction. CEO confidence is nearing an all-time low. Furthermore, the European Central Bank (ECB) is hamstrung from easing monetary policy since inflation significantly overshoots their target. Such turbulence in Europe could present headwinds for our own economic growth.
China, the world’s second-largest economy, faces structural challenges. A deflating real estate bubble, resulting from years of overbuilding, is pulling down economic growth. Given that real estate and related sectors contribute about a quarter of China’s GDP, this poses significant risks. Consumer confidence is also under threat, potentially impacting consumption. The data from July 2023 revealed a 14.5% decline in Chinese exports from the previous year and a 12.4% drop in imports, marking the weakest performance since February 2020. Many experts, both domestic and international, are urging China for a comprehensive monetary stimulus rather than incremental measures.
This downturn in China and Europe will particularly impact other Asian and Latin American economies, as they heavily export to China. A weaker Chinese consumer market affects tourism in the U.S. and Europe, and a sluggish European and Chinese economy can decelerate revenue for global U.S. companies like Nike, Apple, and Caterpillar.
Equity
The equity market experienced a downturn this quarter due to rising interest rates and persistent inflation fears that affected investor sentiment and growth prospects. As we edge closer to the start of the earnings season, these announcements are anticipated to significantly influence stock performance.
Given the heightened investor concerns over the trajectory of interest rates and their repercussions on stock valuations, any earnings results falling short of expectations could lead to a more pronounced negative market reaction.
Earnings Outlook
As the third quarter earnings season approaches, there is growing optimism due to indications of stronger-than-projected growth. The S&P 500 Index companies’ earnings forecasts for this quarter are somewhat more positive than initial predictions made in July.
Moreover, the index is set to experience year-over-year earnings growth, a phenomenon not witnessed since the third quarter of 2022. This resurgence comes as a welcome respite following three straight quarters of decline. This optimistic turn can be partially attributed to analysts revising their current quarter estimates upward, coupled with more robust than anticipated economic expansion.
Historically, analysts have displayed a tendency to reduce earnings estimates in the first two months of a quarter. Therefore, the rise in estimates this quarter is a pleasantly surprising deviation from the norm. FactSet notes that over the past two decades, the average decrease during these months stands at 2.9%. Luckily, this quarter breaks from that trend. The narrative for top-line growth is in line with this positive trajectory; revenue forecasts for the third quarter have escalated, with year-over-year revenue growth expectations for the S&P 500 Index now at 1.6%. This uplift in both profit and revenue projections marks a refreshing contrast to preceding quarters.
Several distinct trends are emerging across the sectors. Notably, eight out of eleven sectors are forecasted to witness a surge in year-over-year earnings. Leading the way are the Communication Services and Consumer Discretionary sectors. The strength in the Consumer Discretionary sector underscores the resilience of consumers, suggesting that the U.S. has potentially staved off a recession. These sectors have been instrumental in driving the stock market’s returns in 2023, with Technology stocks soaring by 32.6%, Communication Service stocks by 37.6%, and Consumer Discretionary stocks by 25.5%. In contrast, the Energy, Basic Materials, and Healthcare sectors are anticipated to experience a decline in year-over-year earnings.
Outlook For 4th Quarter 2023 & 2024
As we turn our attention to the fourth quarter, the estimates and expectations appear even more encouraging. Part of this rise in estimates stems from the low baseline established a year ago for earnings and revenue comparisons, while the other can be attributed to the resilience of the economy.
Analysts are expecting a robust earnings growth of 8.3% in the final quarter of 2023, with projected revenue growth at 3.9%. Projections further out into the calendar year 2024 also look healthy, especially when compared to previous years. The growth estimates for the 2024 calendar year indicate double digit earnings growth of 12.2%. The pressing question going forward is: can these companies genuinely meet these robust expectations?
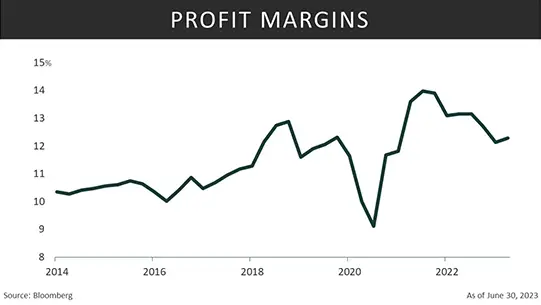
Emerging trends among U.S. companies offer optimism, especially considering the challenges faced over the past year. For instance, FactSet notes that mentions of “inflation” and “recession” in conference calls have significantly decreased quarter-on-quarter and are notably lower than their peaks last year. Moreover, profit margins, which have faced pressure over the last two years, might pivot to become a tailwind. This change can be attributed to easing inflationary pressures and the nearing end of the cycle of rising interest rates. If both the economy and consumer sentiment remain strong, this should bolster the projected growth in earnings for the upcoming quarter and year.
Valuations
The rise in the markets over the past year is placing stress on valuations as they look a little stretched relative to historical averages. While valuations are not necessarily the best timing indicator, they do suggest heightened risk and the potential for subdued long-term returns. FactSet reports that eight of the eleven sectors within the S&P 500 Index are currently more expensive than their 10-year average when valued from their respective forward 12-month Price Earnings (P/E) ratios. Specifically, the S&P 500 Index trades at a multiple of 18.5 times its anticipated earnings for the forthcoming 12 months, surpassing the 10-year average multiple of 17.7. While forward estimates are optimistic, any failure to meet these expectations could push valuations even higher, making stocks even more overvalued. It is noteworthy that valuations typically decline due to a drop in the numerator (price) rather than a spike in the denominator (earnings).
Investor Sentiment
Investor sentiment is an important indicator that can provide valuable insights into the stock market dynamics. At its core, it embodies the collective feelings and perceptions of investors about the market’s direction. Sentiment can be influenced by a wide array of factors, including economic indicators, news, geopolitical events, and even the stock market’s own advances and declines. Traditionally, we have used these indicators from a contrarian standpoint. When investor sentiment is high and remains elevated it can signal the markets are overbought and the risk is high. Conversely, when sentiment is low and investors are pessimistic, it can signal the markets might be oversold, presenting a potentially attractive buying opportunity. However, it is important to underscore that sentiment metrics yield the best results when combined with other indicators, rather than being solely relied upon.
Over the past year, bullish investor sentiment has surged dramatically, a stark contrast to the bearish levels observed in 2022. The previous year was marked by pronounced pessimism, as escalating interest rates and looming recession fears gripped the markets. We have seen sentiment shift and nearly all the pessimism has disappeared, buoyed by a robust equity rally and optimism that the Federal Reserve may be approaching the culmination of its interest rate hike cycle.
The Investors Intelligence indicator has undergone a shift, with bullish sentiments now outnumbering bearish ones. Historically, when the spread between bulls and bears exceeds 40, it often suggests an overbought market or a heightened risk of a downturn. Currently, however, the spread is approximately 28, signaling no immediate market peak.
Credit Spreads
Monitoring credit spreads can provide stock investors with valuable insights into the overall health of the corporate debt, emerging risks, and broader market sentiment. These indicators assist in pinpointing moments when the risk for stocks and the broader economy is tilted to the downside. So, where do we stand today? The spread between U.S. Treasury bonds and corporate debt have narrowed from their wider margins seen in 2022 and continue to trend lower. This tightening suggests that the perceived risk associated with corporate debt is now lower, with investors seemingly more at ease with corporate credit risk. For now, these spreads don’t flash any alarming signals. However, a subsequent widening could hint at upcoming challenges for companies.
Seasonality
One aspect we are closely watching as the year concludes is the influence of seasonality on stock returns. Seasonality refers to the recurring patterns that occur in markets at specific times of the year. These patterns can be influenced by a variety of factors, such as weather, holidays, economic cycles, and investor behavior.
Historical data from Ibbotson for U.S. large-cap stocks, tracing back to 1950, reveals that the fourth quarter has typically been the most robust of the four, although there is no guarantee past performance will continue into the future. With an average gain of 5.0%, it notably exceeds the average of 2.4% seen in the other three quarters. While the fourth quarter is not always in the green, history suggests it rises 83% of the time. Given the recent market softness coupled with potential pauses by the Fed, we believe there’s an opportunity for stocks to gain positive momentum as the year wraps up.
Fixed Income
The U.S. economy remains resilient, staving off a recession and achieving modest yet positive growth, bolstered by the inherent strength in the labor market and consistent service consumption. Federal Reserve officials are targeting a ‘soft landing’ — aiming to curb inflation without driving the economy into a recession. Even though inflation has receded from over 9% last summer to currently around 3.7%, concerns about a potential resurgence in prices linger. Supply-related surges in oil prices are a significant concern for inflation, as historical trends show that elevated energy costs have often been associated with U.S. recessions, notably in the 1970s, 1980s, and 1990s.
In August, U.S. inflation growth exceeded expectations, suggesting potential rate shifts by the Federal Reserve and heightening concerns about renewed economic growth’s role in these price increases. However, at its meeting on September 19-20, 2023, the Federal Reserve maintained the federal funds target rate between 5.25% and 5.50%. This decision came after 11 rate hikes since March 2022, with a brief pause in June to address inflation concerns. The tone of the September meeting was decidedly more hawkish than market expectations. Yields reached new multiyear highs across various maturities. Although the target rate was kept stable, the Federal Reserve’s hawkish commentary indicates a potential for further monetary tightening in the future.
Single month inflation surges are unlikely to radically shift the Fed’s stance, but the path to disinflation might see some turbulence. Any unanticipated inflation could rattle markets, potentially amplifying volatility.
The Fed may also adopt a “higher for longer” strategy, forgoing immediate rate hikes in favor of maintaining prolonged periods of elevated rates. With rising oil prices, elevated inflation, and an unexpectedly robust economy, it is likely that the Central Bank might keep rates at, or close to, a sixteen-year peak for much of the next year. The last time the 10-year Treasury yield reached these levels was on 10/17/2007, with a rate of 4.57% — a post-2007 financial crisis high.
The 10-year Treasury yield, which is sensitive to economic growth projections, has increased as worries about a recession have diminished. However, this trend might not stem from expectations of greater growth. Instead, it could be attributed to escalating U.S. debt. To fund the deficit, the Treasury Department has revised its debt issuance forecast upward for the second half of the year. The situation is further compounded by Fitch’s recent downgrade of U.S. credit. Additionally, changes in the Bank of Japan’s policy have made U.S. bond investors wary of possible divestment from U.S. Treasuries.
Against this backdrop, market participants anticipate another rate hike by year’s end, possibly during the December 13 Federal Open Market Committee (FOMC) meeting. The decision to implement another rate hike in this meeting will be influenced by data from two additional inflation and labor reports scheduled for October and November, potential disruptions resulting from the United Auto Workers strike, and the resumption of payments on student loans.
Since the beginning of the year, investors have shown a preference for cash, cash equivalents, and floating rate assets. In an environment where central banks are steadily increasing interest rates, a tilt towards cash or floating rate assets seems a logical move. These assets adjust their interest rates in line with the hikes initiated by central banks. Despite the significant equity surge in 2023, many investors sidestepped this, displaying a pronounced preference for cash. Goldman Sach’s data reveals that since the start of the year, money market funds have attracted an astonishing $1 trillion. Typically, these funds have provided improved returns to investors faster than banks. Bond funds have also garnered significant interest, accumulating $236 billion. In contrast, equities drew a more modest sum of $90 billion.
For the upcoming quarter, cash is likely to remain a preferred choice for fixed income investors since the triggers that might spark a significant bond market rally — such as an economic downturn or a pause in Fed rate hikes — are not in play today.
Yet, we believe that, following its aggressive interest rate hikes, the Federal Reserve is likely nearing the end of its rate hiking cycle. As central banks worldwide, including the Fed, Bank of England, and Swiss National Bank, start to conclude their rate hike phases — evidenced by their collective decision this week not to increase interest rates — it becomes prudent to consider longer-term high-quality bonds.
Higher U.S. Treasury yields would increase borrowing costs for both corporations and consumers. This could potentially dent corporate earnings and stymie broader economic growth, posing additional challenges in an already complex financial landscape.
Conclusion
2023 has seen a resurgent stock market, erasing most of the 2022 decline, with large-cap technology stocks, particularly in the AI sector, at the forefront. The allure of AI, with its transformative promise and capacity for innovation and efficiency, has captivated investors. Yet, the market performance has varied: the S&P 500 Index registered notable gains, while the Russell 2000 Index trailed. As is historically the case, the third quarter was volatile. The Energy sector, buoyed by rising oil prices, defied expectations with significant advances, while traditionally defensive sectors experienced declines.
The bond market is grappling with its own set of challenges. Anticipation of more Federal Reserve rate hikes has seen the Bloomberg U.S. Aggregate Bond Index on track for its third straight year of losses. With declining assets across the board, many investors are turning to cash as a safety net. Given the Fed’s “higher for longer” strategy and the possibility of more rate increases, bonds may encounter similar challenges in the months ahead.
The U.S. economic landscape demonstrates resilience, adeptly avoiding recession and sustaining consistent growth. The Federal Reserve walks a fine line, striving to curb inflation while fostering economic growth, but concerns about inflationary spikes remain. The oil market, with its price volatility due to supply factors, amplifies these worries, reminiscent of past episodes where soaring energy costs hinted at economic downturns. The recent inflationary spike, coupled with the September Federal Reserve meeting’s hawkish tone in the context of an already strict monetary policy, suggests potential upcoming shifts.
After a robust Q3, our research suggests the U.S. economy is gearing up for steady growth in the next quarter. Energy prices will significantly influence inflation, but core inflation should continue its moderating trend. While core rates might stay subdued, overall inflation could hover around the high 3% mark by year-end. As the labor market moves toward a balanced dynamic, the unemployment rate could approach 4%. Consequently, we believe the economy appears poised to maintain its growth trajectory.
Economic growth has surpassed expectations, raising optimism for earnings. The upcoming quarter and year will test whether companies meet these heightened expectations. Our stock outlook for the fourth quarter remains cautiously optimistic. While the late-stage business cycle and uncertainties surrounding the Federal Reserve pose challenges, promising signs include projected earnings growth and favorable seasonality. Investors might consider reallocating gains from top-performing sectors and exploring momentum in previously lagging, defensive sectors to mitigate risk.
For Investors:
Economy
―In Q4, U.S. economic growth should continue to be strong, albeit at a slower pace than Q3.
―Moderating labor market: from extremely tight to healthy balance between labor demand and supply.
―Robust U.S. consumer balance sheets and historically low leverage ratios are tailwinds to consumption. But headwinds to consumer spending exist:
-
- Resumption of student loan repayments,
- Depletion of pandemic-induced excess savings,
- Higher energy prices,
- The lagged impact of high interest rates.
―Manufacturing contraction may be ending as some green shoots are surfacing.
―Inflation Reduction Act (IRA), and CHIPS Act continue to support the non-residential fixed investment of GDP due to the onshoring of supply chains and the renewable energy transition.
―The trajectory of headline inflation will continue to be influenced by the path of energy prices, while core inflation should moderate to the high 3% mark by year-end.
―Eurozone and China weaknesses are concerns for global economic growth in the months ahead.
Stocks
―The S&P 500 Index is projected to break a trend of three consecutive quarters of earnings decline in the third quarter after analysts turned more optimistic and increased estimates.
―Estimates for the fourth quarter and 2024 show encouraging signs of robust earnings and revenue growth.
―The spread between bullish and bearish sentiments sugwgests no immediate market peak.
―Narrow credit spreads between U.S. Treasury bonds and corporate debt indicate reduced perceived risk associated with corporate debt.
―Seasonality favors stocks. Historically, the fourth quarter sees the most robust stock returns, exceeding that of the other three quarters.
Fixed Income
―The Federal Reserve is targeting a ‘soft landing’, aiming to manage inflation without triggering a recession. The recent hawkish tone suggests potential future monetary tightening.
―The “higher for longer” strategy from the Fed is likely to lead to increased borrowing costs for both corporations and consumers, which could impact corporate earnings and overall economic growth.
―The 10-year Treasury yield has surged to a multi-year high, driven by reduced recession concerns, growing U.S. debt, a Fitch credit downgrade, and worries over the Bank of Japan’s policy.
―Investors have shown a preference for cash and floating-rate assets, with a notable $1 trillion influx into money market funds year-to-date, surpassing equities.
―The trend is expected to persist into the fourth quarter, as many market participants foresee another Federal Reserve rate hike by year’s end.
―S&P 500 Index valuations are stretched compared to historical averages. Forward estimates are optimistic, but failure to meet expectations could push valuations higher.