
An Indepth Forecast Of The Year 2024
2023 Recap
The year 2022 was marked by significant financial extremes, including the highest inflation and the most substantial Federal Reserve (Fed) rate hikes in four decades, along with the steepest yield curve inversion and the highest mortgage rates in over 40 years. In contrast, 2023 is emerging as a year of considerable ‘narrative volatility’ in the macroeconomic landscape, with heightened fluctuations in financial assets, particularly in fixed income. Market expectations have fluctuated between fears of recession, hopes for a ‘soft landing’, and concerns over overheating, with the current consensus leaning towards a ‘soft landing’, where inflation could be brought back to central banks’ 2% target without significant economic slowdown or major job losses.
Concurrently, the markets are assimilating rapid advancements in artificial intelligence (AI) and speculating on its potential effects on long-term productivity and profitability. This anticipation plays a key role in the resilience of the U.S. equity market, especially in the context of rising bond yields. In fact, companies likely to benefit from the AI revolution have driven most of the gains in the S&P 500 Index year-to-date. These gains are primarily attributed to what are popularly known as the ‘Magnificent 7’ companies (Amazon, Apple, Google, Meta, Microsoft, Nvidia, and Tesla). As of December 13, 2023, at the time of this writing, the year-to-date Bloomberg Magnificent 7 Total Return Index has surged by 102%, while the equally weighted S&P 500 Index (representing the average stock) has gained only 11.68% in the same period. NVIDIA, a leader in the AI revolution, has seen its value increase by 229% year-to-date, making it the best-performing stock in the S&P 500 Index in 2023.
Reversing the trend from 2022, in 2023 growth stocks outpaced value stocks by a wide margin, and cyclical sectors performed better than defensive ones. All defensive sectors, including Consumer Staples, Utilities, and Health Care, have lost money year-to-date. Larger stocks, represented by the S&P 500 Index, have yielded a return of 24.52% year-to-date, while small-cap stocks, represented by the Russell 2000 Index, have seen a modest increase of only 12.15%. This represents the widest margin since the late 1990s. The Technology sector rallied by 54.5%, and the Communication Services sector also advanced by 48.2%, making them the two best-performing sectors of the year. In contrast, the Utilities sector saw a decline of 4.2%, while the Consumer Staples sector experienced a 1.2% decrease.
The year was marked by notable fluctuations in bond yields, with the 10-year U.S. Treasury bond escalating to 4.99% in October, a significant rise from April’s low of 3.30% and the 3.87% observed on January 2. The rates for a 30-year mortgage also surged to 8.9% by October 25, 2023, reaching a level last seen in 2000. The Bloomberg U.S. Aggregate Bond Index, a comprehensive indicator of the bond market, has recorded a year-to-date gain of 4.20%. Meanwhile, in the commodities market, oil tanked while gold shined.
The most significant news of the year came from the final meeting of the Federal Open Market Committee (FOMC). They announced the end of the central bank’s monetary tightening campaign, projecting three rate cuts for 2024. This shift overshadowed the expected announcement that the U.S. central bank was holding rates at current levels for a third consecutive meeting, with the current range remaining at 5.25% to 5.5%.
The financial markets reacted positively to the Fed’s change in direction, leading to a surge in stock prices and a reduction in government bond yields. Virtually every sector of the financial markets joined in the broad gains after the meeting: Global stocks soared, world currencies strengthened against the dollar, and corporate bonds saw a significant rally.
Economy
Economic resilience in 2023 has surprised most economists and market participants, including ourselves. At the end of 2022, expectations were that a recession in 2023 was inevitable, due to the record tightening cycle that the Fed was embarking on. Instead, the economy is on pace to log nearly 2% Real Gross Domestic Product (GDP) growth for 2023.
What went wrong with the forecasts? First, the spending by U.S. consumers and corporations was underestimated. There were substantial excess savings accumulated during the lockdown years, which needed time to be spent by consumers, and significant fiscal aid to small and mid-size companies supported economic growth. These factors powered the labor market, which in turn supported robust consumer income.
Second, weaker demand from the U.S. and China helped to substantially lower oil prices. Falling oil prices act as a stimulative measure for households by freeing up more income, which can then be spent on other consumer items. This dynamic is essentially equivalent to a fiscal easing for households, as it increases their disposable income.
Third, pent-up demand following years of restricted mobility due to the COVID pandemic continued to unfold, leading consumers to spend on services, from sporting events and vacations to concerts, which led to a booming service economy.
Finally, fiscal initiatives from the Inflation Reduction Act (IRA) and CHIPS and Science Act (CHIPS) led to spending on new manufacturing facilities, from solar and battery to semiconductor plants. All these factors helped offset the weakness in the most interest-rate sensitive parts of the economy: the housing and manufacturing sectors.
How Do We See The Economy Evolving In 2024?
In a nutshell, we anticipate the economy will slow down but avoid entering a recession in 2024. Barring any major exogenous shocks, such as a pandemic, a geopolitical shock, or a significant credit event, it is important to remember that each phase of the economic cycle takes time to unfold. We believe we are currently in the latter part of the cycle. However, it is crucial to recognize that the late stages of a cycle can be prolonged, with various economic factors having the potential to either extend or shorten this phase.
To better understand the dynamics of this particular late cycle, let’s take a closer look at different segments of the economy.
Labor Market
Broad measures of the labor market indicate that labor demand and supply are moving back into balance. For instance, the Bureau of Labor Statistics publishes its monthly Job Opening and Labor Turnover Survey (JOLTS) report, which offers several ratios that provide insights into labor market trends.
Firstly, the ratio of job openings per unemployed person stands at 1.34 as of October 2023. This figure has been trending downward from its peak of 2.0 jobs per unemployed person in March 2022, suggesting that companies are marginally reducing their hiring needs. For context, this ratio remains above the pre-pandemic level of 1.2.
Secondly, the quit rate, a measure of employee confidence in finding new jobs, is at 2.3%, similar to the pre-pandemic rate but down from a cycle high of 3.0% in March 2022.
To anticipate near-term unemployment trends, one of the best series to monitor is the Department of Labor’s initial and continuing unemployment claims data. These data are regarded by labor economists as leading indicators. As of this writing, the weekly initial claims numbers are averaging around 220,000 a week, a low figure that does not indicate any significant weakness.
However, the Continuing Claims data, which represents repeat benefit filers, has increased nearly 30% from its level in November 2022. This trend is concerning and suggests that people receiving unemployment benefits are struggling to find new jobs. If this upward trend in Continuing Claims continues into the new year, it would raise concerns about the health of the labor market, a crucial driver of consumer income and spending in 2024.
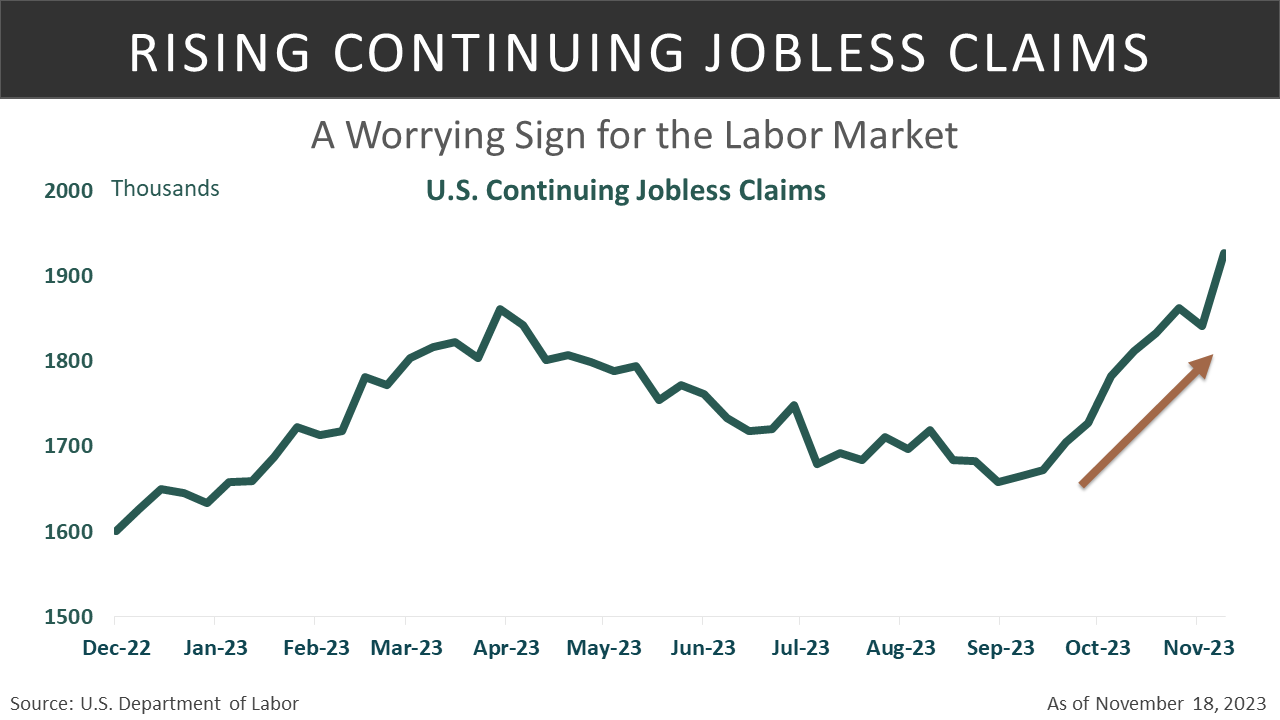
Overall, the labor market is showing signs of loosening, yet remains healthy. The claims data are critical indicators to monitor. Looking ahead to 2024, we anticipate a continued normalization in the labor market, with a potential risk of massive layoffs as companies adjust to the cumulative impact of past rate hikes.
Inflation
U.S. inflation has moderated from its peak in June 2022 of 9.1%. As of the end of November 2023, the latest data available at the time of writing, the Headline Consumer Price Index (CPI) stands at 3.1%. The Core CPI, which excludes the volatile sectors of Energy and Food, is at a year-over-year rate of 4.0% as of November 2023, down from a cycle high of 6.6% in September 2022. This represents significant progress since 2022.
However, overcoming the final stretch of inflation may prove to be more challenging, despite recent promising trends. Inflation doves point to these trends as indicative of a potential decline to 2% inflation by the end of 2024. Fed officials prefer to analyze inflation on a one-, three-, and six-month annualized basis to assess inflation momentum. These metrics reveal a Core CPI rate that is even slower than the year-over-year rate of 4.0%. On a 1-, 3-, and 6-month annualized basis, the November 2023 Core CPI rose 3.5%, 3.4%, 2.9%, respectively, suggesting that recent monthly readings indicate a slowing inflation momentum. If these trends persist, inflation could meet the Fed’s target of 2% by the second half of 2024.
Fed Chair Jerome Powell often divides core inflation into three subcategories: Housing, Services, and Core Goods. To understand the future trajectory of inflation, it is important to examine each of these subcategories. Let’s start with an analysis of shelter inflation.
Shelter Inflation
There is a major component of the CPI basket that could significantly impact inflation progress in 2024: shelter inflation. It accounts for 33% of the Headline CPI and 42% of the Core CPI baskets. Therefore, any substantial progress in this component will greatly contribute to bringing inflation towards the target, due to its sheer weight in these baskets. Currently, it stands at a 6.5% year-over-year inflation rate. Excluding shelter inflation from the October 2023 Core CPI brings it down to 1.9%, aligning with the Fed’s target. Thus, it is important to identify a leading indicator for the official CPI Shelter component.
Firstly, the Bureau of Labor Statistics (BLS) measures shelter inflation by averaging all lease contracts from the past 12 months. This includes leases signed nearly a year ago, when rent and home prices were at their peak, potentially obscuring the current real-time shelter inflation that reflects more recent prices. The rental and housing industry offers private measures of real-time shelter inflation, such as the Zillow Observed Rent Index. This index focuses on the latest signed leases from the previous month. As shown in Chart-1, this series leads the official CPI Shelter component by 13 months. Assuming no unforeseen shocks occur, we can expect a gradual decrease in core CPI in the new year as the largest component starts to decline.

Core Goods Inflation
Core goods inflation, which tracks the change in prices of core goods such as furniture, apparel, new and used cars, medical care products, and similar items, was at a negative 0.8% on an annual rate over the six months ending in October 2023. This rate is slightly below its pre-pandemic average, primarily due to the normalization of supply chain bottlenecks and deflation stemming from weak economic growth in China, which affected import prices.
However, the deflation in core goods (declining prices) that we observed in 2023 may be nearing its end. Firms have been reducing excess goods inventories for a year, and 2024 could see companies rebuilding these inventories, potentially contributing to the narrative of persistent inflation.
In conclusion, the progress in reducing inflation is quite promising. Factors such as the anticipated disinflation in housing, the decline in core goods prices, and the recent downtrend in wage growth easing super-core inflation, all point towards inflation returning to target in 2024. This scenario paves the way for the Fed to eventually cut rates, stimulating a slowing economy and achieving the holy grail of successful monetary policy: softly landing the economy.
Consumer Spending
Consumer spending, which represents two-thirds of the economy, is the main driver of economic growth. The economy has demonstrated resilience in 2023, largely due to U.S. consumers spending their excess savings. Looking ahead to 2024, a loosening labor market and a slowdown in economic activity are expected to impact consumer spending. This will likely occur through lower income growth and increased saving rates as consumers adopt more cautious behavior. It is important to note that the saving rate is still far below pre-pandemic levels, and a normalization in saving could significantly drag down consumption in 2024.
The excess savings accumulated during the pandemic years, when mobility was restricted, have been largely spent by lower- and middle-income cohorts. However, the higher-income cohort has not yet depleted their excess savings, although it is diminishing. Meanwhile, the rapid growth in credit card balances, up 11% year-over-year, suggests that some households (likely a minority) may continue high spending levels even after depleting their excess savings.
In summary, while we anticipate that the consumer will continue to show resilience in 2024, the aforementioned factors are likely to slow their consumption to below-trend levels. Nevertheless, we still expect to see modest spending growth in the coming year.
Residential & Non-residential (Business) Investment in 2024
Residential Investment
After experiencing a boom during the pandemic years of 2020 and 2021, fueled by the work-from-home phenomenon and a growing preference for larger living spaces, the housing market entered a phase of normalization in 2022 and 2023. This shift was largely due to the substantial rise in mortgage rates, which significantly slowed the existing home market. While this situation led to a decrease in supply in the existing home market, it simultaneously provided a boost to new home builders, enabling them to capture a larger share of the housing market.
Many consumers had locked in or refinanced their mortgages at record-low rates during the pandemic. Consequently, when mortgage rates surged in 2023, numerous homeowners chose to stay put, avoiding the higher rates that would come with selling and purchasing a new home. This behavior significantly reduced the supply of existing homes for sale. On the other hand, homebuilders began offering mortgage rate buy-downs to attract new buyers, compensating for this by building smaller homes.
The current situation in the housing market is challenging, with both home prices and mortgage rates at decade-high levels, leading to the worst affordability since 2007. This has particularly impacted Millennials, many of whom are at the prime age for homeownership. In our view, lower interest rates, and consequently lower mortgage rates, are the only solution to revitalize the slowing single-family housing market.
In the multi-family (apartments) housing market, overbuilding in recent years has resulted in a more balanced supply and demand. A positive aspect of this overbuilding is its potential to exert downward pressure on rents, which could aid the disinflation process.
In conclusion, residential investment is likely to remain under pressure until rates decrease.
Business Investment
Business investment has been on the rise since the pandemic, with intellectual property spending remaining robust and surpassing pre-pandemic levels. The IRA and the CHIPS Acts are providing government subsidies for plants specializing in semiconductor manufacturing and clean energy equipment, such as solar and batteries. Numerous projects, including Intel’s Ohio fabrication plant, have commenced, and spending on such facilities is expected to continue increasing in 2024, thereby boosting GDP.
Conversely, banks are tightening their lending policies for commercial and industrial loans, which is likely to affect other business investments with a six-month lag, posing a particular challenge for small and medium-sized businesses. Next year, credit growth may turn negative due to banks’ delayed response to rising interest rates.
Overall, despite these challenges, both residential and non-residential investments are expected to contribute to GDP in 2024. This contribution will be particularly evident if the Federal Reserve successfully calibrates the Federal Funds rate to facilitate a soft economic landing.
Equity Market
As we look ahead to the coming year, we foresee both challenges and opportunities for the stock markets. The evolving landscape, influenced by changing characteristics and shifting economic factors, is poised to significantly impact market dynamics. Key themes for investors will include inflation and interest rates, slowing economic growth, technological advancements, and geopolitical events. While there is optimism about the potential for continued growth, uncertainties remain regarding the health of the consumer, the labor market, inflation expectations, central bank policies, and the future trajectory of interest rates. Understanding the interplay between these variables and identifying pivotal trends will be crucial in successfully navigating the stock market in 2024.
Valuation & Fundamentals
Fundamentals and valuation are essential aspects of investment analysis, which investors use to evaluate a company’s financial health and growth potential. Fundamentals encompass the underlying financial metrics of a company, such as revenue, earnings, and market share. In contrast, valuation involves determining a stock’s intrinsic value based on various factors, including price-to-earnings (P/E) ratios, price-to-sales (P/S) ratios, and other financial metrics. Investors utilize these factors to make informed decisions about buying or selling stocks, with the goal of identifying undervalued assets and avoiding overpriced ones. Analyzing historical trends and current valuations can help investors discern critical market trends and guide their investment choices.
While using valuation as a timing indicator may not always be advisable, it can reveal attractive opportunities for long-term investors. Our latest analysis indicates that valuations for large-cap stocks are slightly above their 10-year norms but remain reasonably priced. In contrast, smaller companies have become cheaper due to price declines over the past few years. Historically, small-cap stocks are assigned higher multiples due to increased risk, often stemming from higher leverage compared to large-cap stocks. Currently, they are relatively inexpensive compared to their larger counterparts. Small-caps, which are more sensitive to economic growth, present some concerns due to the current late phase of the business cycle. However, barring a shift to negative growth, the reduced valuations in the small-cap sector may offer worthwhile opportunities for investment.


The start of the new year suggests strong fundamentals for companies, setting optimistic expectations for 2024. A comprehensive understanding of these fundamentals, including earnings and revenue estimates, is crucial for investors aiming to identify trends, potential growth, and the factors influencing the equity markets.
Currently, expectations for earnings per share (EPS) growth, a key metric for assessing equities, remain robust. According to FactSet data from the end of November 2023, earnings growth is projected to increase by 11.7% for the calendar year 2024. This growth is primarily driven by four sectors: Information Technology, Financials, Health Care, and Communication Services, which collectively account for about 60% of the overall growth.
Moreover, top-line revenue growth is also anticipated to be strong in 2024, with current estimates forecasting a 5.4% increase in sales. The primary contributors to this healthy revenue growth are expected to be the Health Care, Consumer Staples, Consumer Discretionary, and Financial sectors.
However, as we analyze the trends in the fourth quarter of 2023 and the projections for 2024, we observe an increase in downward revisions from analysts and companies. Recently, there has been a notable trend of companies issuing more downward guidance revisions than upward ones, at a ratio of about 2 to 1 for the final quarter of the year. Although the outlook for 2024 remains positive, there have been modest reductions in analysts’ projections for both revenue and earnings.
Earnings growth projections for 2024 have slightly decreased from an initial estimate of 12.5% at the start of the fourth quarter 2023. These adjustments appear to be broad-based, affecting eight of the eleven sectors. Similarly, revenue growth is also experiencing downward revisions from earlier expectations in the quarter, with sales projections being lowered in eight of the eleven sectors.
Our Take On Fundamentals
What do we foresee for earnings and sales in 2024? While our current outlook for earnings and sales growth in 2024 is generally positive, we acknowledge potential headwinds despite the easing of inflation and market expectations of Federal Reserve rate cuts. First, we anticipate economic growth to slow in 2024; Bloomberg forecasts Real GDP growth of just 1.2% for the year. Our Chairman, Barry James, often remarks that when the economy grows at a rate below 2%, it tends to feel like a recession.
Given these projections for economic growth, we believe the current forecasts for earnings and sales growth may be somewhat optimistic. How did we reach this conclusion? We examined past periods of similar economic growth, adjusting for inflation, and analyzed how these conditions historically influenced revenue growth for equities. If the expected slowdown in growth materializes in 2024, our analysis suggests that revenue growth may be weaker than currently anticipated.
In conclusion, our research indicates that expectations for 2024 may need to be moderated. We anticipate that projected weaker top-line growth will eventually impact bottom-line results, likely leading to more downward revisions early in the year. Fortunately, we still expect overall growth to remain positive, although forecasts will likely need downward adjustments to reflect the anticipated economic softness more accurately.
Global Outlook
The global economic outlook is marked by caution as factors such as slowing growth in the United States, recessionary conditions in Europe, and a deceleration in China exert pressure on global markets. Recently, a summit near San Francisco between Chinese President Xi Jinping and U.S. President Joe Biden, their first meeting in a year, aimed to ease rising tensions between the two nations. While this meeting may have temporarily stabilized relations, significant challenges loom in 2024. Upcoming elections could greatly influence the dynamics between these countries, depending on the election outcomes.
Analysts are highlighting the ‘3D’ challenges — deflation, debt, and demographics — that are impacting growth in China. China is not experiencing the growth levels of the past, with deflation evident as CPI prices decline year-over-year. The country’s debt, now exceeding 300% of GDP, raises concerns amid rising defaults and a struggling real estate sector. Additionally, an aging population and slowing birth rates in China present further obstacles to long-term growth.
In Europe, central banks are leaning towards maintaining higher interest rates, leading to deteriorating credit growth, tighter financial conditions, and weaker economic momentum. Consequently, sluggish growth in these major economies is likely to negatively impact emerging markets worldwide. Although international markets currently seem undervalued, our outlook is not bullish at the start of the year. However, the situation could become more favorable in the second half of the year.
Indicators
Regarding momentum, our long-term indicator for the S&P 500 Index has maintained a favorable positive trend since earlier in the year, indicating stability. Historically, when this indicator is favorable, we see better risk-adjusted returns compared to unfavorable periods. Small-cap stocks have been more volatile bouncing back and forth over the past several months from unfavorable to favorable. Fortunately, the latest rally has been beneficial and turned the momentum positive once again.
Turning to sentiment, investor sentiment has been remarkably stable and largely neutral throughout 2023. Similarly, institutional investors, as indicated by the Bank of America Global Fund Manager Survey, also demonstrate neutral sentiment. The absence of euphoric levels, which are often indicative of market tops, and the minimal presence of excessive pessimism, typically seen at market bottoms, are noteworthy.
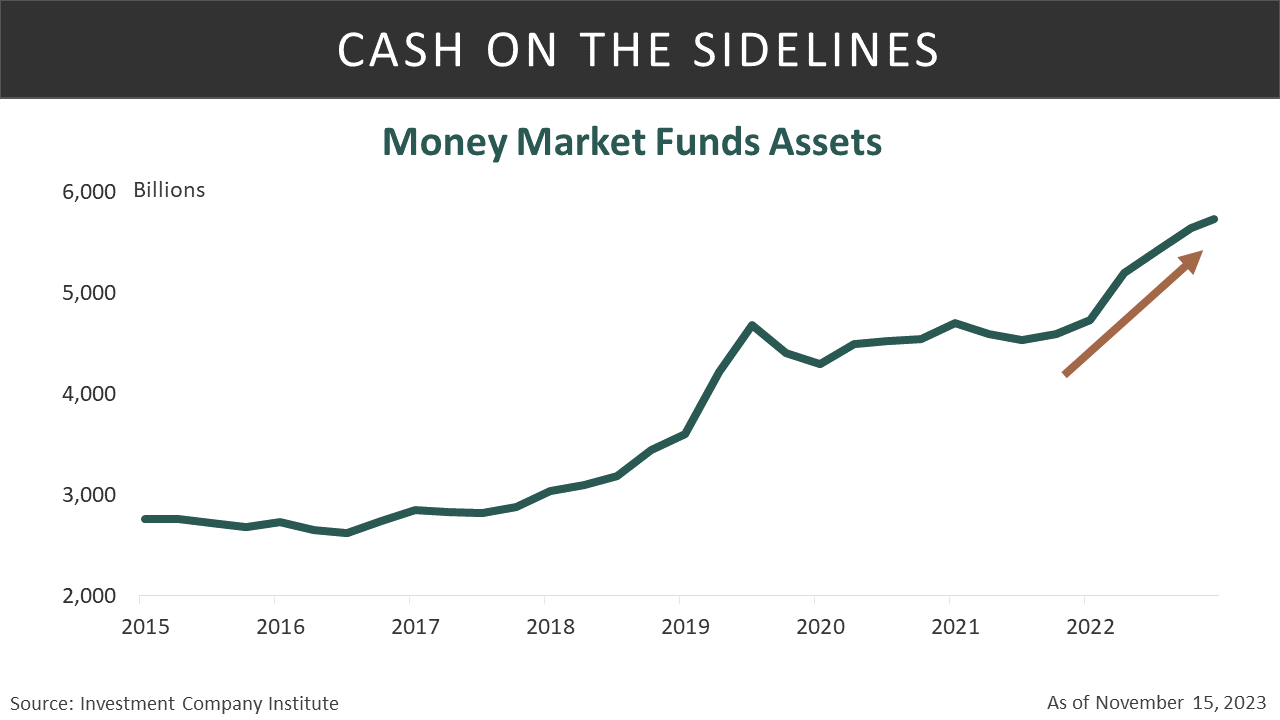
Moreover, cash levels are above average, with significant amounts remaining in money market funds following massive inflows in 2023. According to the latest data from the Investment Company Institute (ICI), there is nearly $5.8 trillion in money market funds, marking an increase of $1.2 trillion over the past two years. Should inflation ease and interest rates eventually decline, this could act as a powerful tailwind for equities, potentially encouraging investors to shift towards riskier assets and opportunities.
The year 2024 will be significant as voters head to the polls to elect America’s next President. Historically, presidential election years have favored stock investors, a trend dating back to 1928. On average, the return during such years has been a robust 11.6%, with positive outcomes 83% of the time. Potential policy shifts and changes in leadership can significantly influence investors’ psyche and financial markets. While the presidential election indicator is not infallible and is no guarantee of future results, historical trends suggest that stock markets typically fare well during presidential election years.
Fixed Income
Since hitting a low of 3.25% on April 6, 2023, and a peak of 4.99% on October 19,2023, the yield on the 10-year U.S. Treasury Note has been declining. This recent shift in market sentiment can be attributed to key factors, particularly the year-over-year CPI data indicating a greater-than-anticipated easing in inflation.
The Fed’s December decision to keep interest rates at a 22-year high was accompanied by new forecasts of 75 basis points worth of cuts for the next year, signaling a more dovish outlook for rates compared to previous projections. Not only did the Fed signal the end of its multiyear tightening campaign, but officials also considered sharper cuts to borrowing costs in 2024 to ensure a soft landing for the economy.
The shift was motivated by the Federal Reserve’s more optimistic view of inflation, anticipations of slower economic growth, and a slight increase in projected unemployment for the upcoming year. Federal Reserve Chair Powell also pointed out that the complete impact of the rising interest rates, which had been in effect since March 2022, had not yet been fully experienced throughout the economy.
Economists, who had been predicting a “higher for longer” scenario, now see a different perspective. Powell emphasized the Fed’s awareness of the risk of waiting too long to cut rates, acknowledging the need to avoid that mistake. However, with the uncertain inflation outlook, economists argued that the Fed needed to avoid exuberant outcomes that could complicate the task of taming price pressures.
Following the meeting, Powell alluded to these risks in his remarks, underscoring that prematurely declaring victory over inflation was unwarranted, and there was no guarantee of sustained progress.
Additionally, various indicators have pointed to a long-awaited cooling in the labor market. Since October 27, 2023, U.S. bonds had one of their strongest performance in decades, driven by increasing optimism about potential interest rate cuts by the Federal Reserve next year.
Inflation & Labor Market
In discussions about inflation, the Federal Reserve frequently emphasizes its data-dependent approach. This means that its decisions are guided by recent economic indicators such as the Consumer Price Index (CPI), the Producer Price Index (PPI), and Personal Consumption Expenditures (PCE).
Adding complexity, the Fed analyzes these figures after seasonal adjustments, excludes food and energy costs, and has recently started focusing on a measure termed the ‘Super Core” (Core CPI excluding Shelter and Core Goods).
Jerome Powell, the Chairman of the Federal Reserve, has consistently expressed the target of achieving a 2% inflation rate.

Although inflation has been decreasing from its peak levels, it is yet to reach the Fed’s 2% threshold.
Fed’s Dot Plot
The Federal Reserve’s dot plot is a critical tool used by the central bank to communicate its outlook on interest rates and monetary policy. It is a visual representation of individual policymakers’ views on the future of the federal funds rate, which is the short-term interest rate controlled by the Fed. Each member of the Federal Open Market Committee (FOMC) places a dot on the chart to indicate their expectations for the federal funds rate for the next few years and for the long run. It is released quarterly.
Advantages of the dot plot include transparency and the ability to offer insights into the FOMC’s collective thinking. It allows investors, businesses, and the public to gauge the direction of interest rates, helping them make informed financial decisions. Additionally, the dot plot can highlight dissent within the FOMC, shedding light on differing views among policymakers.
However, there are also disadvantages to the dot plot. It is not an official consensus forecast, and each member’s projection may be based on different economic models and assumptions. As a result, it lacks consistency in how the dots are generated, making it challenging to interpret the thinking behind them. Furthermore, only some of the regional Fed presidents are voting members of the FOMC.
In the recent December release of the dot plot, it indicated a more dovish stance among FOMC members compared to the previous one. The federal funds rate currently stands at 5.25% to 5.5%, marking a 22-year high. However, the dot plot suggests that most FOMC officials anticipate a potential 75 basis points of rate cuts next year.
While the market had priced in more aggressive rate cuts, with traders expecting around 150 basis points of cuts, the Fed’s projection still signaled a significant shift towards monetary accommodation. This shift was evident in the dot plot, where no FOMC members expected further rate increases, in contrast to the previous projections made in September. More than half of the members now anticipate at least half a percentage point of cuts in the next year.
The market’s reaction to the dovish dot plot was notable. Yields on two-year Treasury notes dropped by 0.21 percentage points in response to the news, reaching a six-month low of 4.52%. Ten-year yields also fell, hitting 4.07%, the lowest level since September 1. This shift in yields reflects the market’s perception that lower interest rates could be favorable for economic conditions and equities.
However, the discrepancy between the Fed’s dot plot and the market’s expectations highlights a potential divergence in outlook. The Fed’s median dot implies three rate cuts next year, while traders were pricing in deeper cuts. This suggests that the market may be more pessimistic about economic growth, inflation, and employment than the Fed’s projections.
In summary, the dot plot is a critical tool for understanding the Fed’s monetary policy outlook. It provides numerical insights into individual committee members’ expectations for interest rates, and the recent shift towards a more dovish stance has influenced market dynamics. While the dot plot offers valuable transparency, its limitations, such as the lack of a binding commitment and the variation in economic models used by members, should be considered when interpreting its implications for future monetary policy.
Money Supply
A key component influencing inflation is the money supply. An increase in the amount of money circulating within the economy is a crucial factor that can contribute to rising prices.
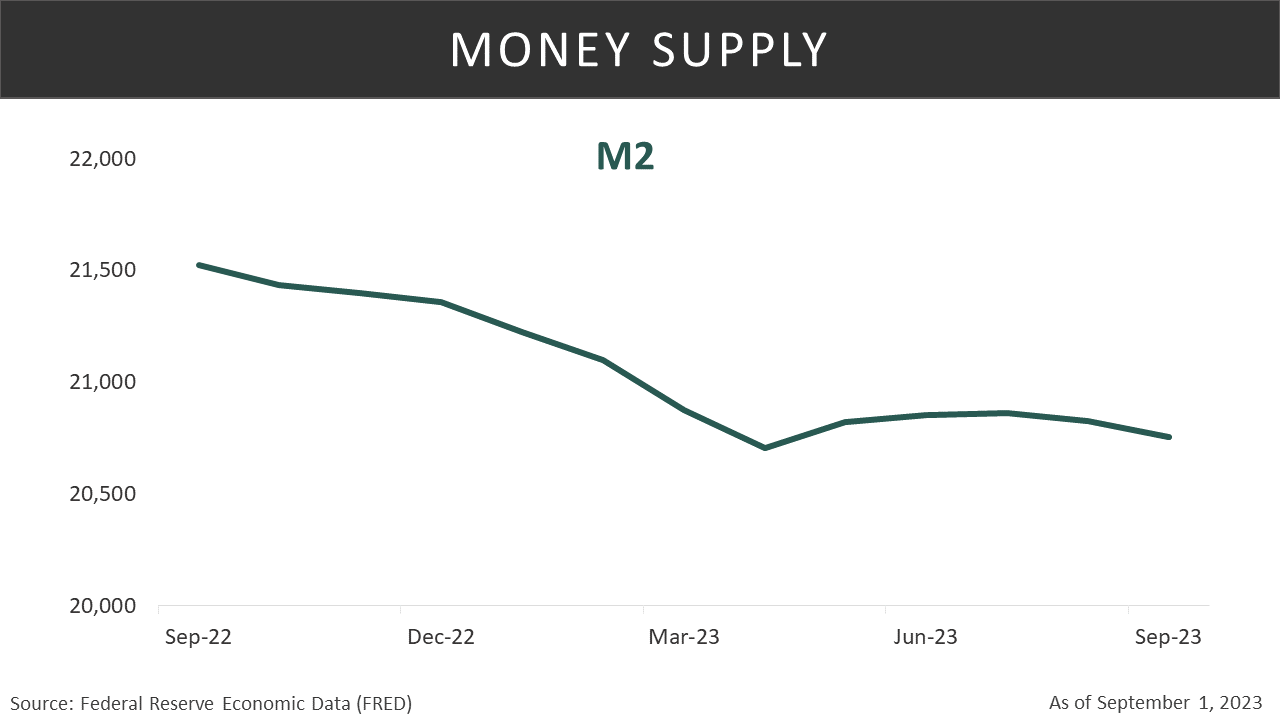
Recently, there has been a decrease in the money circulating in the economy, a trend that could aid in combating inflation. Specifically, the M2 money supply has declined by 3.6% in the last 12 months.
The Federal Reserve’s mandate involves maintaining inflation at manageable levels while pursuing sustainable maximum employment. Regarding the latter part of this mandate, as previously noted, broad indicators of the labor market suggest labor demand and supply are moving back into balance.
Higher For Longer
The Federal Reserve continues its pursuit of a ‘soft landing,’ aiming to reduce inflation without triggering a recession. Maintaining higher interest rates is seen as a way to keep borrowing and lending subdued. Consequently, the Fed has announced the end of its rate increases cycle. One potential outcome is an economic slowdown triggered by these higher rates, a situation that often leads to decreased rates as investors turn to bonds for safety. The market interpreted the Federal Reserve’s decision not to raise rates for the third consecutive time on December 13, 2023, as a sign that the period of rate hikes has come to an end. This perception led to an influx of buyers and short sellers covering their positions, which in turn brought rates down again. With the recent dot plot, many investors speculate that the Fed will lower rates sooner than later.
Quantitative Tightening
Regardless of the likelihood of another rate increase, the Federal Reserve’s quantitative tightening (QT) is proceeding without interruption. The Fed is actively decreasing its Treasury and mortgage-backed securities (MBS) holdings. As of now, it has trimmed its balance sheet by over $1.1 trillion since QT started in June 2022. In practical terms, this equates to a monthly reduction of $60 billion in Treasuries and $35 billion in agency debt/MBS, totaling $95 billion per month.
Higher Treasury Supply
Over the summer, the U.S. yield curve experienced a bear steepening of 40 basis points, driving long-term bond yields close to their highest levels since the pandemic. This was primarily driven by the heightened Treasury issuance needed to fund the fiscal deficit.
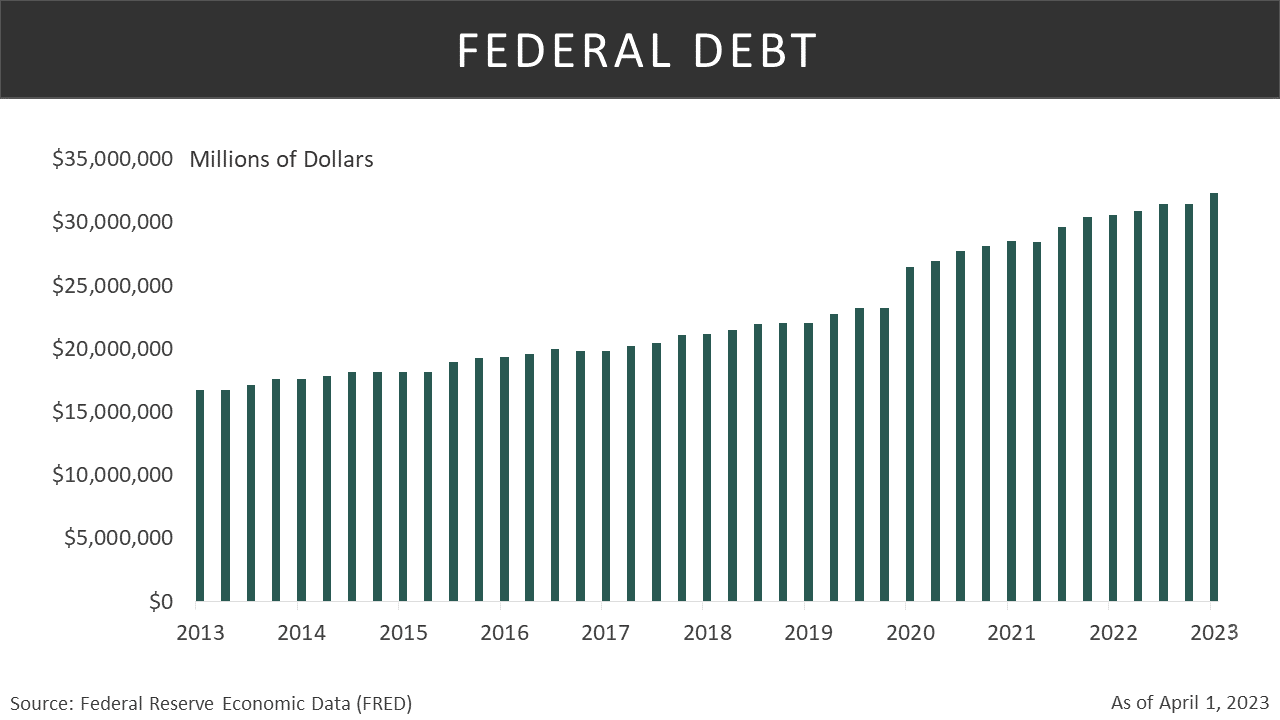
Previously, there were concerns about the excessive debt accumulated by the United States government, and this was years ago. Currently, the Total Public Debt issued by the U.S. Federal Government has surpassed $32 trillion. This equates to approximately $97,000 for every woman, man, and child in the United States. With such a staggering figure, questions are being raised about the feasibility of repaying this debt. Additionally, if the government continues to issue more debt, there is uncertainty surrounding potential buyers and the consequent impact on interest costs. An increased supply of debt, without a corresponding rise in demand, could lead to an imbalance, potentially causing bond prices to fall.
Bond Spreads
U.S. investment-grade corporate bond spreads have fallen to levels last seen in 2022. This decline reflects investor confidence that the Federal Reserve may have finished its cycle of rate hikes and reduced concerns about a potential recession. This metric represents the additional yield investors require to hold corporate bonds over U.S. Treasuries. According to Bloomberg data, as of this writing, spreads for high-grade bonds are at 101 basis points, while those for speculative-grade bonds are at 362 basis points. Notably, on July 5, 2022, the spread for speculative-grade bonds relative to U.S. Treasuries was 583 basis points.
Conclusion
The 2024 U.S. economic outlook is cautiously optimistic, relying on a ‘soft-landing’ scenario where the economy slows but continues to grow, aided by Federal Reserve rate reductions as inflation moderates. Several factors are expected to contribute to this inflation moderation, including a decrease in shelter inflation, a normalization of supply chains, and controlled wage growth. Collectively, these elements increase the likelihood of inflation meeting its target and potentially triggering a Federal Reserve interest rate reduction.
The success of this scenario depends on the Federal Reserve’s flexibility in adjusting policies, especially if early progress on inflation aligns with the target. The expected trajectory of the labor market, featuring a modest rise in unemployment, aligns with this ‘soft-landing’ scenario.
Consumer spending is predicted to decelerate but remain positive, with its direction contingent on the Fed’s policy stance. The housing market may continue to stagnate due to high mortgage rates and prices unless there is a significant drop in mortgage rates. Signs of a manufacturing recovery offer hope, and in general, a gradual economic slowdown without recession is anticipated for 2024.
Globally, the economic outlook remains cautious, with concerns about slowing growth in the U.S., recessionary conditions in Europe, and challenges in China. Geopolitical events and upcoming elections introduce uncertainties that investors must navigate. However, the late business cycle stage poses potential challenges, including downward trends in earnings revisions and stress on consumer spending due to higher prices. A weakening labor market and low consumer confidence contribute to this challenging landscape. In terms of investment, intermediate and long-term indicators suggest neutrality with positive momentum for large-cap stocks, while small-caps remain attractively priced. We believe Cyclical sectors are gaining appeal over defensive sectors.
The Federal Reserve’s pivot strategy has generated differing opinions on the timing and number of rate changes. While the hope for Fed easing replaces the earlier “higher for longer” sentiment, quantitative tightening continues. Concerns about debt sustainability, the impact of government spending on the economy, and bond markets persist. Lower investment-grade corporate bond spreads reflect increased confidence in the Fed’s approach and reduced recession fears.
In fixed income, we favor bonds with intermediate and longer maturities, as we believe that interest rates have peaked in this cycle. Additionally, we see value in high-quality bonds and agency mortgage-backed securities.
Our economic forecast faces several potential risks. These include persistently higher-than-anticipated inflation, a reversal in the Fed’s rate-cutting strategy, escalating geopolitical conflicts, surging oil prices, or economic data that significantly deviates from expectations. These factors introduce an element of uncertainty into the economic landscape in the coming year.
For Investors:
Equities
• Favor U.S. investments over international ones
• Consider profitability as a crucial driving factor
• Focus on interest sensitive sectors such as Financials, Real Estate, and Cyclicals
• Small-cap stocks remain attractive as the Fed changes its policy direction
Fixed Income
• Bonds now provide attractive yields
• Bonds have become a more competitive option compared to stocks
• Consider favoring Treasury and high-quality corporates and municipal bonds
• Consider favoring investment-grade mortgage-backed securities
What Can Go Wrong
• A higher-than-expected inflation rate
• Any Fed increase in interest rates
• Increased geopolitical conflicts
• Surging oil prices
• Economic data significantly deviating from expectations, either weaker or stronger