
1st Quarter
Webster’s Dictionary defines volatility as “a tendency to change quickly and unpredictably”. During the first quarter of 2023 there is no better word to describe what has happened.
January saw a bounce in stocks unlike anything we had seen for quite some time. The S&P 500 Index increased 6.28%, the Russell 2000 Index jumped 9.75% and the NASDAQ Index rallied an incredible 10.73%, all in just one month. Stocks that rallied the most were those that fell the hardest in 2022. We witnessed a snapback in technology and communications stocks, and especially those ‘Meme’ securities, or stocks of a company that have gained in popularity or ‘gone viral’ due to their presence on the internet or through social media.
February on the other hand, witnessed the market rally stall and top out just two days into the month. At the beginning of the month, it was expected that interest rates would begin to level off as inflation subsided. Unfortunately, this was not completely the case. The Consumer Price Index proved to be stickier than originally thought while the jobs market continued to be robust.
The markets tried to make a comeback in March only to be stopped by issues in the banking sector. Higher interest rates were troublesome for the banks for multiple reasons. First, bank customers realized they could potentially earn more in T-bills than in traditional savings accounts causing bank customers to keep lower levels of cash in their accounts. At the same time, banks had invested their reserve funds in Treasury notes. As rates increased, these Treasury notes held by the banks declined in value. The ‘forced’ sales created losses for some banks pushing them near to or actually into default. Fears of a banking crisis pushed the industry into its own bear market in the period of just three days. Despite a turbulent start to the year, the S&P 500 managed to achieve a modest gain of approximately 7.5% during the first quarter.
Much of what occurred with stocks can be said for the fixed income markets as well. Perhaps this is due to the fact stocks rallied as interest rates declined. March on the other hand was a bit different. For the first time in months, we saw the true diversification that bonds can offer in a difficult environment. As worries of a potential bank run swooned, so did bond prices as investors witnessed a true flight to quality. This short rally pushed the Aggregate Bond Index up over 3.2% for the first quarter.
The big news continuing to impact the markets is the potential for a banking crisis. Three banks in the United States have failed and moved under receivership year-to-date. On a more global scale, Credit Suisse has faced its own issues in Europe due to its perceived lack of liquidity. If these problems can be contained, the potential for a smooth recovery remains intact. However, if they turn into more of a contagion, the possibility of a recession may become more ominous.
Economy
Hard Landing vs. Soft Landing
The U.S economy, though more resilient than expected by economists, is still facing significant challenges for the rest of the year. The Federal Reserve (Fed) has increased short-term interest rates from 0% to nearly 5% in a year, marking one of the fastest tightening cycles in 40 years. Historically, every rapid tightening cycle since 1970 has ended up in a recession (a hard landing). While there have been instances when the Fed raised rates, resulting in a soft landing where the economy slows down just enough to avoid a recession and an inflation spike, it was proactively done to fight forecasted inflation. The 1994-1995 and 2015-2018 tightening cycles are examples of such soft landing periods. However, in the current tightening cycle, the Fed is reactively raising rates in the middle of an inflation surge making it harder to predict whether a soft landing is achievable.
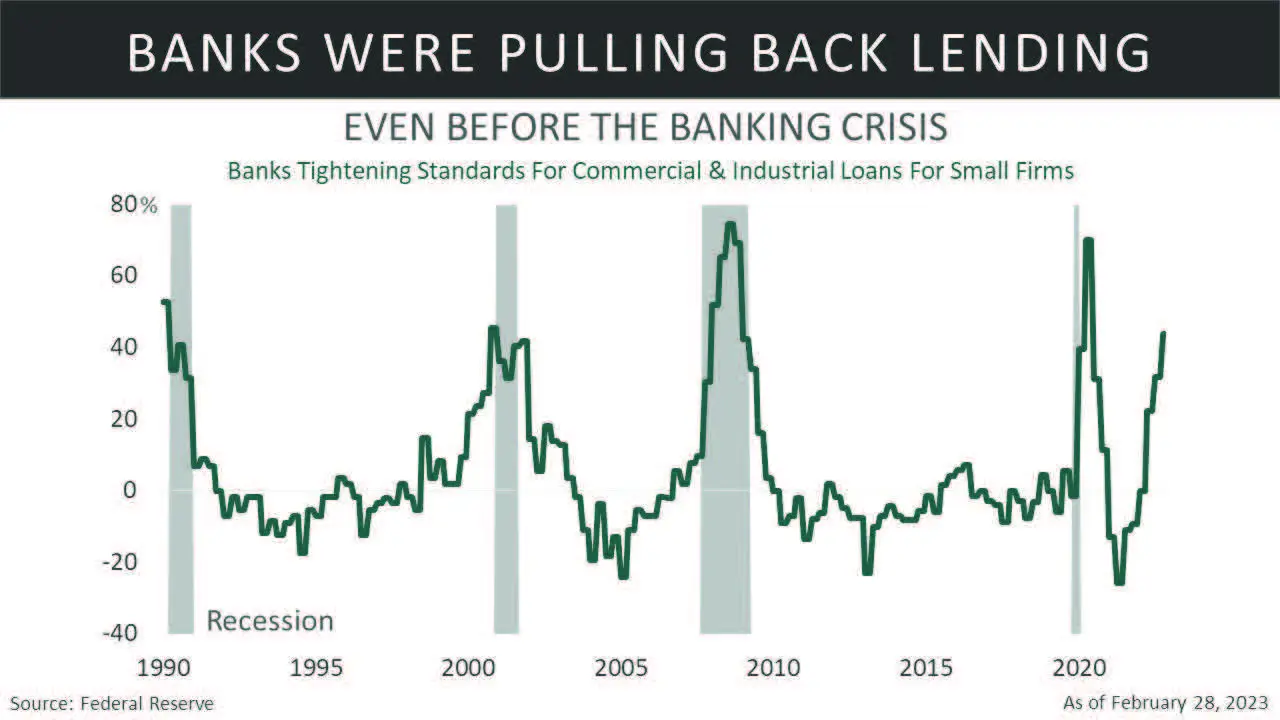
Additionally, in past soft landing periods, the banks were not tightening lending standards as is the case today. Even prior to the recent banking crisis, banks were lending less. This crisis has accelerated the tightening trend. Furthermore, it is important to note that the effects of the Fed’s rate hikes on the economy work with a long and variable lag, with some economists estimating the lag time to be between 12 and 18 months from the initial rate hike.
The Fed first hiked in March 2022, albeit the forward guidance moved the bond and stock market ahead of the first hike. Nevertheless, the 12 to 18 month lag means the effects of the Fed’s tightening over the past year will start to show up in the next 6 months. Ironically, the unfolding banking crisis may be the first result of this tightening cycle.
In sum, the rapid tightening cycle, 40 year high inflation, and banks significantly tightening their lending standards may increase the odds of a hard landing later this year. However, the second quarter will most likely continue to show positive growth, albeit decelerating, given the recent momentum of consumer spending and the labor market.
The Banking Crisis
The current banking crisis is a result of the rapid rise of the Fed Funds rate in the past 12 months and the subpar risk management by some of the banks’ leaders. Banks make money by paying depositors the lowest possible rate in their saving accounts and lending and/or investing the proceeds in higher-rate loans and/or securities. When rates were low in 2020 and 2021, many banks were awash with deposits due to the massive stimulus programs, and they had invested them in long-term Treasuries and Mortgage Backed Securities (MBS) that were generating generational low yields.
When the Fed started hiking rates in 2022 to fight inflation, the bond market repriced lower causing bond prices to decline (bond prices decline when interest rates rise). This, in turn, left many banks with massive unrealized losses in securities. A recent academic paper titled “Monetary Tightening and U.S. Bank Fragility in 2023: Mark-to-Market Losses and Uninsured Depositor Runs?” estimates that U.S. banks were sitting on $620 billion in unrealized losses (assets that have decreased in price but haven’t been sold yet) at the end of 2022. As result, the marked-tomarket of banks’ assets have declined by an average of 10% across all banks, with the bottom 5th percentile experiencing a decline of 20%.
We believe the Fed backstop facility has helped us avoid more drastic impacts of this crisis on the rest of the banking system. However, future economic growth will be impacted through more stringent lending standards and potentially tighter banking regulations.
This crisis is a result of the most rapid tightening cycle in 40 years. In our view, the banking crisis is a disinflationary shock that will bring inflation down as aggregate demand is impacted by banks pulling back and as a result companies scaling back in hiring and investing.
The U.S. Consumer
Stepping back and looking at the bigger picture, households have spent many years deleveraging after the Great Financial Crisis (GFC). At the peak in 2007, household debt to disposable income was over 140%, meaning households took on more debts than their disposable income. As of the end of 2022, that number was around 100%. Therefore, household balance sheets are still in a better place.
Additionally, consumers are still supported by excess savings of $1.4 trillion per Bloomberg Economics estimates. Even though this excess savings is dwindling and some of it may be illiquid, the bulk of it is held by high-income households. This is still better than having no excess savings and being over-leveraged like in preGFC. Some economists estimate households have 6 to 12 months of spending capacity. We believe this should be supportive for consumer spending in the next couple of quarters, and is why we do not see an imminent recession.
Leading Indicators
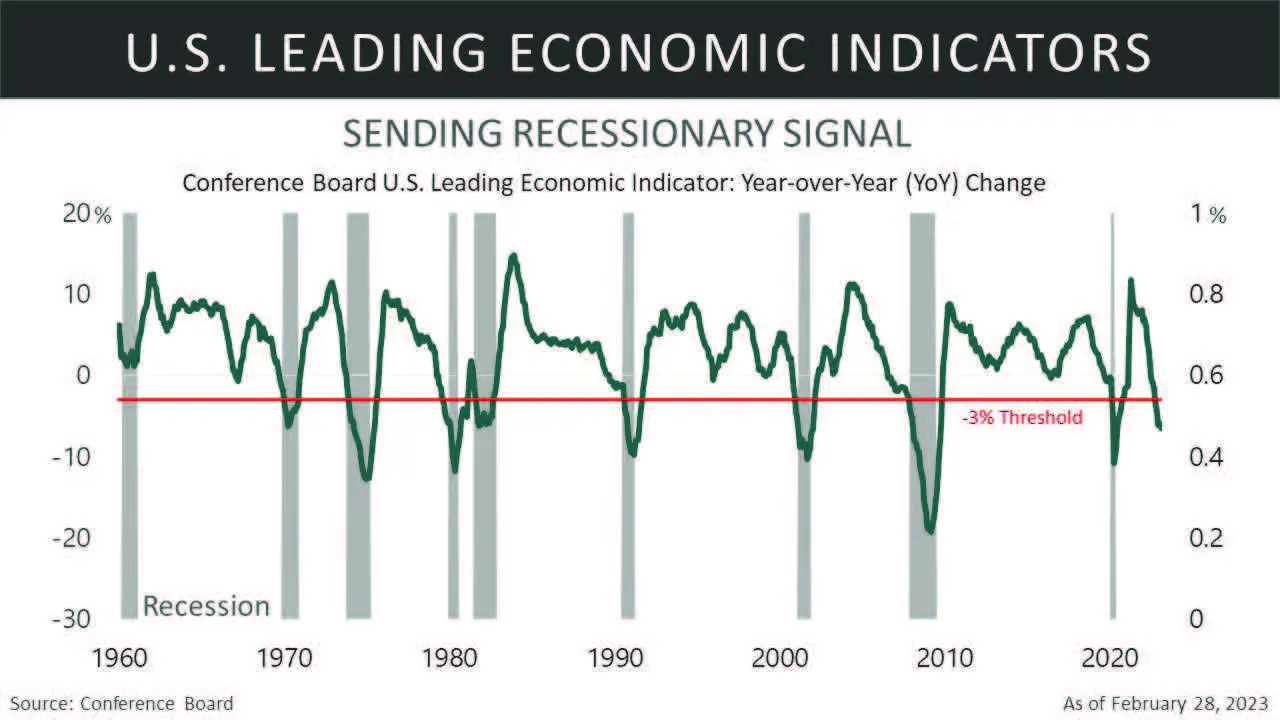
Since our 2023 Economic Outlook update, the Conference Board Leading Economic composite indicator continues to deteriorate. The year-over year change is now -6.5% as of the end of February. In all economic cycles since 1950, a U.S. recession has historically followed shortly after this indicator crosses the -3% threshold. The composite index includes 10 indicators that have a track record of leading the economy.
These include the average workweek as employers tend to cut hours before cutting staff. It has been declining. Additionally, the composite includes the Institute for Supply Management (ISM) new orders, which is a good leading indicator for sales. This has been in contraction territory since October 2022. Building permits are another indicator in the composite, which is a good proxy for future housing activities. Permits have been in a downward trend and have declined by more than 500,000 since March 2022. The weakness is especially acute in the residential sector. Overall, the Conference Board Leading Composite Indicator is still pointing to major economic contraction ahead.
When Will the Lag Effects Impact the Labor Market?
The resilient labor market continues to surprise many market participants. It is important to note there are many structural forces at play due to a once in 100year global pandemic. For example, there are three million workers who decided to either retire early, have long-covid, have a lack of childcare services and/or the pandemic reset their work-life priorities.
These factors have lowered the workforce pool, especially for lower paying jobs and high-skilled jobs, leading to higher wage growth and contributing to more persistent inflation as robust aggregate demand continues to be supported.
History shows that Fed hiking cycles impact the labor market with a long and variable lag as interest rates rises impact consumer and corporate spending, which eventually lead to job losses.
Technology companies have initiated mass layoffs in the past few months, which will eventually be reflected in the initial jobless claims data. However, it is important to note that technology companies over hired in 2020 and 2021 as the pandemic resulted in the pull-forward of demand for their products and services. Additionally, the total employment in the technology sector accounts for only around 2% of the total U.S. employment.
Based on past economic cycles, the most impactful job losses show up in commercial and residential construction and manufacturing areas. As the Fed raises interest rates, mortgage rates rise, making homes less affordable and slowing down housing activities. When activities slow, homebuilders start to lay off construction workers. In this cycle, they have been more reluctant to let go of these workers as it was extremely difficult to find workers during the pandemic years. However, in our view, this cohort is likely to experience layoffs as homebuilders start protecting their bottom lines. Studying economic cycles, a fall in construction fixed investment precedes a fall in construction jobs and recessions. However, it is crucial to remember that these developments take quarters and not months to unfold. We expect softness in the labor market in the second quarter, but not outright negative non-farm payroll prints.
Manufacturing Sector
Manufacturing continues to weaken in the first quarter. The Regional Fed surveys are still showing weakness in this part of the economy. The national Institute for Supply Management (ISM) Manufacturing Purchasing Managers Index (PMI) survey still shows a downward trend in manufacturing. Although there was some stabilization in the new orders component of the survey, it still shows a sector in contraction. The new orders index leads the actual headline figure.
When looking at Industrial Production data, business equipment and consumer goods are both declining from their 2021 high. Additionally, there is a strong correlation between the monthly industrial production figure and the goods segment in the Real Gross Domestic Product (GDP). The weakness in industrial production in the first two months of 2023 will be a negative contributor to GDP. In other words, the goods economy is experiencing a major slowdown.
Inflation
Inflation in the U.S., as measured by the Consumer Price Index (CPI), has been coming down from its peak of around 9% in June 2022, to 6% as of the end of February 2023. Fed Chairman, Jerome Powell, has split inflation into three components, goods inflation, housing inflation, and services excluding-housing inflation. The goods inflation has come down sharply as supply chain bottlenecks eased and the demand for goods waned as consumers ventured out of their homes and spent more on services. On the other hand, housing inflation is still high, but is expected to slow down significantly by the end of the year reflecting the weakness in the housing market. Finally, the services ex-housing is staying stubbornly high as of the latest February inflation report. This component of the consumer basket is highly correlated with wage growth. The Fed is trying to engineer a softness in the labor market to decrease wage growth and overall aggregate demand and by consequence lower price inflation.
In our view, inflation will continue to come down through the end of the year as the labor market softens and deaccelerating housing inflation starts to show up in the data. However, we still believe there are structural forces that will keep it higher than the stated Fed target of 2% in the long run, namely deglobalization, green energy transition, manufacturing onshoring, and more hostile geopolitics.
Equity
Revenues
Despite earnings lagging expectations, revenues have been a bright spot for companies over the past year (2022), growing a healthy 11.1%, which exceeded the 7.6% estimate at the start of the year. The energy, real estate, consumer discretionary, and industrial sectors posted stronger revenue growth than the S&P 500, while financials, communication services, and information technology lagged.
The strong consumer, labor market, and rising prices were just a few reasons for the robust sales growth throughout 2022. Consumers were not swayed by the rising costs and spending continued at a healthy pace. In the coming year, companies could get more help as inflation concerns begin to recede. According to FactSet, companies are less focused on inflation in their filings than in previous quarters, although the number remains higher than historical averages. This trend reversal from the peak in mid-2022 is a positive sign that the worst of inflation might be over.
The strong revenue growth seen in 2022 is not expected to continue into 2023, with expectations for weakened revenue growth across all sectors due to the slowing economy. Among the sectors, energy, utilities, and materials are expected to see revenue decline. The energy sector is not a big surprise given the weakness in oil prices and the slowing economy. While financials are expected to be one of the stronger groups, the rise in interest rates and risk in the banking sector will make it challenging to meet these revenue growth expectations.
Looking ahead, we anticipate that revenue growth will remain positive but will likely be lower in 2023 than in previous years. Estimates for revenue growth stand at only 2.1% for the calendar year, a significant drop from last year’s double-digit growth. Inflation is expected to trend lower and will impact nominal revenue growth resulting in a slower pace. As higher costs continue to erode consumer savings, we also anticipate less consumer spending in the year ahead. If economic activity weakens and the risk of a recession increases, we believe revenue growth could turn negative by the end of the year.
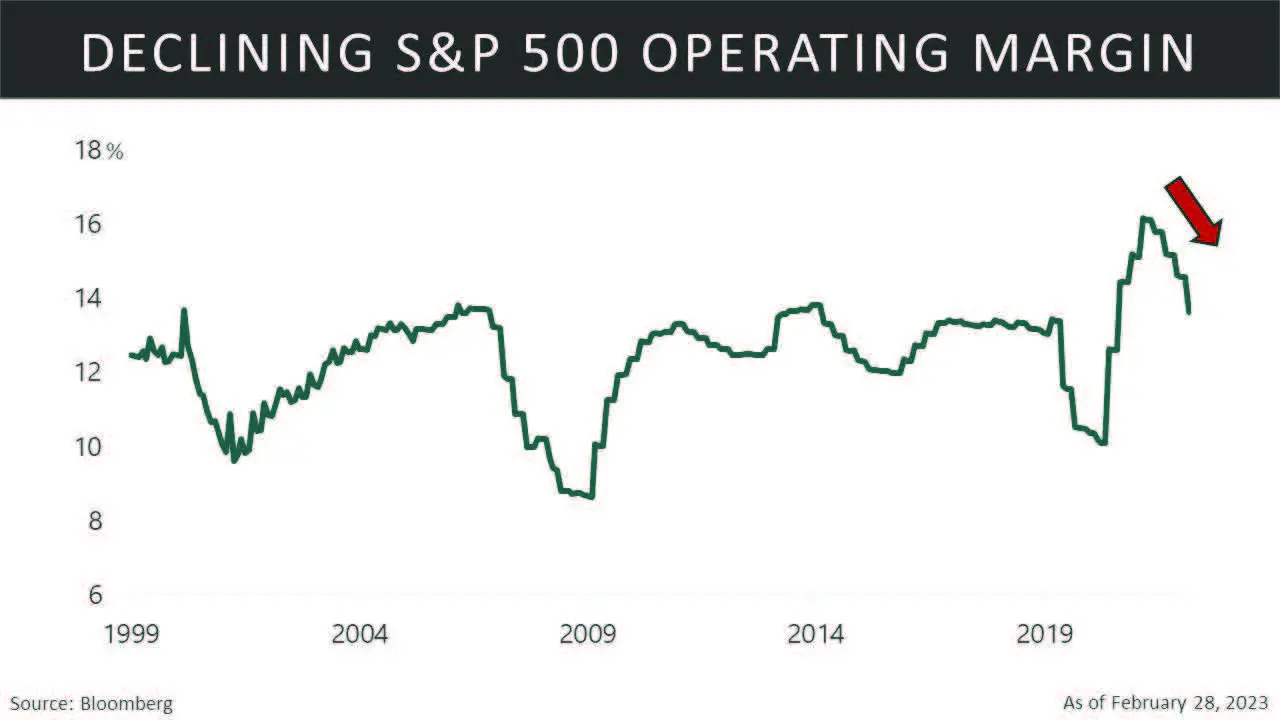
Margins and Earning
While revenues have remained robust, earnings and profit margins have not been as resilient in recent quarters. Moreover, earnings estimates, and guidance have been continually reduced as we begin 2023. In our February newsletter, we highlighted that earnings will likely deteriorate due to higher input costs putting pressure on margins, and it seems that this trend will continue into the middle and possibly the latter half of 2023 based on the latest data.
At the start of last year, earnings were expected to grow by 9.4%. However, as the Fed began hiking interest rates to fight inflation, higher input costs and wage increases began cutting into company profits.
This was apparent in the release of 4th quarter earnings as the reality set in that companies were not going to meet expectations. Earnings growth continued to deteriorate as higher costs and weaker than expected revenues took a toll on earnings. As a result, earnings declined by 4.9%, leading to a larger-than-expected miss for the entire calendar year. Unfortunately, this trend is continuing and is concerning for earnings in 2023. In fact, since the start of the year ten of the eleven sectors have seen downward revisions in their earnings per share (EPS) estimates.
The stronger dollar has also had a big impact on earnings over the past year, especially for companies with significant international exposure. In the fourth quarter alone, FactSet reported companies with more than 50% of revenue from the U.S. experienced stronger revenue and earnings growth than those with less than 50%. However, in recent months, the U.S. dollar has weakened against its major trading partners, which could provide some relief for companies with foreign revenues in the coming quarters.
Risk and Market Indicators
Over the past year, we highlighted our long-term momentum indicators were negative as the market trended lower and eventually fell into a bear market. Today, we have seen a shift as these have finally turned favorable as the market has rebounded from its lows of the past year. We are closely monitoring these indicators as the recent banking crisis has weakened them and they are teetering between signals and could easily shift back to an unfavorable signal if we see further weakness.
Retail investors are holding strong and even maintaining relatively high equity allocations, which in the past have been good indicators of a market bottom when investors finally give up and capitulate. However, equity valuations remain relatively high compared to market bottoms, and with the concerns for earnings and margins at the start of the year, there could be further Price-to-Earnings (PE) multiple compression. Unfortunately, multiples have not fallen to levels associated with the end of bear markets, and with the possibility of a future recession, this could lead to further declines in the market.
Fixed Income
In the first quarter, investors in the bond market have weathered some of the most turbulent market swings in recent history. The widely watched MOVE Index, a measure of expected volatility in Treasuries, has more than doubled between February 1st and March 15th. The yield on U.S. two-year notes, typically considered a low-risk investment, has fluctuated between 3.83% and 5.07% within the March 8th to March 17th timeframe. This marks a 32% decline from the yearto-date high to the lowest levels in just seven trading days. These gyrations in interest rates are fueled by the uncertainty about the course of the Federal Reserve monetary policy and the banking crisis resulting from the collapse of Silicon Valley Bank.
The direction of interest rates will depend on whether the Fed prioritizes concerns about the financial system’s health or focuses on elevated inflation and the resilient labor market, despite its most aggressive tightening campaign in decades. The widely expected 25 basis point increase implemented during the Federal Open Market Committee (FOMC) meeting on March 22nd sent a strong signal that the Fed is still worried about inflation. Chairman Powell stated that, if necessary, the central bank would raise rates beyond what was anticipated. The Fed may be taking a calculated risk that, while three banks have failed, the broader banking system has consistently undergone stress tests, maintained sufficient liquidity and ample capital. Additionally, the Federal Reserve’s new lending facility, backed by the U.S. Treasury Department, will assist banks in meeting the demands of their depositors and reduce their asset-liability mismatches.
However, one likely spillover from the banking crisis is that banks will start tightening credit, a process that was already underway before this crisis, according to the Senior Loan Officer Opinion Survey on Bank Lending Practices. This tightening of credit may trigger a recession. This likely scenario and the risk of financial system instability may cause the Fed to consider pausing its series of aggressive moves, which started in March 2022.
The combination of a decrease in interest rates and the flight-to-quality caused by the crisis of confidence in lenders in the U.S. and Europe has already led to a significant rally in government bonds and widening in credit spreads.
The increase in risk aversion is likely to benefit the higher quality segment of the fixed income market and the widening spreads will make investment in high yield and emerging market debt less appealing.
Additionally, higher yields are now back across the curve and a more typical correlation between stocks and bonds is taking shape. This may signal a timely return for the time-tested 60/40 portfolio approach (60% in equity and 40% in bonds) after one of its worst years on record in 2022. The diversification benefits it has typically provided in the past disappeared last year as both bonds and equities suffered steep losses.
Conclusion
The U.S. economy is currently in a late cycle phase with historically low unemployment. However, we anticipate deaccelerating economic growth, lower price inflation, and a softening labor market. The banking crisis is expected to improve with the help of the Fed liquidity backstop facility and increased Treasury and FDIC support to boost confidence in the banking system. Nevertheless, we anticipate deposits to continue seeking higher money market yields rather than bank deposit rates. The commercial real estate sector remains a concern as refinancing costs increase and remote work reduces the demand for office space. It’s important to note that regional banks are particularly vulnerable due to their high exposure to commercial real estate loans.
Overall, we anticipate the economy to continue growing in the second quarter, although at a slower pace than previous quarters.
The outlook for corporate earnings in 2023 is anticipated to be weak, with further deterioration expected in the first half of the year. As a result, we recommend a cautious approach, focusing on large companies, defensive sectors, and those with strong revenues and the ability to pass along higher costs.
We suggest sticking with high-quality bonds as rising volatility, caused by the uncertainty of the Fed’s interest rate path and the banking crisis, is likely to pose challenges for the bond market.
For Investors:
Economy
― The Banking Crisis Increase The Odds Of A Credit Crunch
― Expect The Lag Effects Of The Fastest Tightening Cycle In 40 Years To Start To Show Up In The Economy In The Next 6 Months
― The Tightening Of Lending Could Be Deflationary And Would Help Lower Aggregate Demand And Lower Inflation
― Excess Saving Is Waning, But Still Supportive Of The U.S. Consumer
― Labor Market Continue To Be Resilient, But Some Softness Is Starting To Show Up
― Manufacturing And Housing Are Still Weak
― No Imminent Recession In Q2 Of 2023, But The Odds Of Hard Landing Later In The Year Have Increased
Stocks
― Expect Weaker Revenue Growth In 2023, Compared To The Previous Year
― Earnings And Margins Will Remain Under Pressure In The First Half
― Expect Downward Revisions In Earnings
― Market Risk Indicators Have Improved But We Remain Cautious
― Valuations Remain High, Expect Further Declines
Bonds
― Inflation Is Slowing But Still Elevated
― Widening Credit Spreads
― Higher Yields Across The Curve
― The Typical Correlation Between Bonds And Stocks Is Back
– Improved Outlook For The 60/40 Portfolio Approach
― Favor High Quality
– Treasury Bonds
– Municipal Bonds
Disclosure
This information is of a general nature and does not constitute financial advice. It does not take into account your individual financial situation, objectives or needs, and should not be relied upon as a substitute for financial or other professional advice to assess, among other things, whether any such information is appropriate for you and/or applicable to your particular circumstances. In addition, this does not constitute an offer to sell, or the solicitation of an offer to buy, any financial product, service or program. The information contained herein is based on public information we believe to be reliable, but its accuracy is not guaranteed. Investing involves risks, including loss of principal. Past performance is no guarantee of future results.
Definitions
Large Cap: are defined as the group that account for the top 70% of the total market capitalization of the U.S. equity market. Small Cap: are defined as the group that account for the bottom 10% of the total market capitalization of the U.S. equity market. Consumer Price Index (CPI): Measures the average change in prices over time that consumers pay for a basket of goods and services. 10-year U.S. Treasury Yield: used as a proxy for mortgage rates. It’s also seen as a sign of investor sentiment about the economy. *Russell 2000® Index: measures the performance of the small-cap segment of the U.S. equity universe. The Russell 2000® Index is a subset of the Russell 3000® Index representing approximately 10% of the total market capitalization of that index. It includes approximately 2,000 of the smallest securities based on a combination of their market cap and current index membership. *S&P 500 Index: S&P (Standard & Poor’s) 500 Index: a market-capitalization-weighted index of the 500 largest U.S. publicly traded companies. *NASDAQ: a global electronic marketplace for buying and selling securities on a computerized, speedy, and transparent system. *Indexes are not managed. One cannot invest directly in an index.